Need to create a presentation from a spreadsheet? With Slideform, you can connect a spreadsheet, ask AI to analyze the data, create charts and written takeaways, and generate a Google Slides or PowerPoint deck from the results. The presentation can follow an existing deck you already use, or Slideform can create a new design from scratch.
This is useful when the spreadsheet is the source material, but the final output needs to be a presentation. For example, you might have a Supermetrics export with campaign data, an Excel model with calculations, a Google Sheet with survey responses, or a monthly reporting workbook with pivot tables. Slideform helps turn that spreadsheet into slides instead of making you copy charts and write summary text by hand.
GOAL: Create a presentation from spreadsheet data with charts, insights, and recommendations while keeping the look and feel of your existing deck or a new design theme.
What is Slideform?
Slideform is the AI Analyst for business analytics and reporting. It helps teams connect spreadsheets, dashboards, CRMs, and other business data to branded outputs like Google Slides, PowerPoint, PDF reports, emails, and private dashboards.
Why Spreadsheets Are Hard to Present Well
The hard part is not opening the spreadsheet. The hard part is analyzing the data, calculating the right metrics, summarizing what changed, and deciding what belongs in the deck. There are usually two different spreadsheet-to-presentation workflows. The first starts with raw data. The second starts with a spreadsheet that already has some analysis built in.
Starting from raw data
Raw data might come from Supermetrics, a CRM export, a CSV download, a survey tool, an ads platform, or a product analytics export. It often has lots of rows, technical column names, and no obvious story yet.
In that case, the first job is analysis. Slideform can inspect the columns, use formulas to calculate metrics, look for useful dimensions and trends, and help answer questions like:
- Which campaigns drove the biggest change this month?
- Which customer segments grew or declined?
- What are the top cost drivers?
- Which rows should become charts, tables, or callouts?
Starting from a summarized spreadsheet
Sometimes the spreadsheet is already partly presentation-ready. It may have pivot tables, calculated fields, cleaned tabs, monthly summaries, or charts that your team already trusts.
In that case, the job is less about discovering every pattern from scratch and more about packaging the work into a deck. Slideform can use the existing pivots, summaries, and calculations as source material, then create slides around the most important metrics and takeaways.
Either way, the manual version usually means building charts, writing slide titles, pasting everything into a deck, and cleaning up the formatting. Slideform is meant to make that handoff from spreadsheet to presentation much faster.
What Slideform Does with Spreadsheet Data
Slideform helps with the parts that usually sit between analysis and presentation. It can review and analyze the data, identify key metrics and trends, create charts and tables, write slide headlines and summaries, and place the results into a deck.
For example, a spreadsheet of paid media data could become a short campaign performance deck. A financial workbook could become a monthly P&L presentation. A survey export could become a research readout with charts, segment differences, and recommendations.
Automate Your Spreadsheet Reporting Workflow
Here is the basic process:
How to Create a Presentation from a Spreadsheet with AI
Step 1: Connect the spreadsheet
Start with the spreadsheet you want to turn into a presentation. The sheet can contain raw data or tables you have already formatted and summarized. This could be a Google Sheet, an Excel file, a CSV export, or a reporting workbook with multiple tabs.
Useful examples include:
- Supermetrics exports for paid media, SEO, or social reporting
- Excel files with revenue, expense, and margin calculations
- Survey response spreadsheets
- Sales pipeline exports
- Customer health or product usage spreadsheets
If your report starts from a dashboard with existing visuals and KPIs you want to reuse, you can start from that instead of a spreadsheet. If your reporting starts in Google Sheets specifically, read our companion guide on how to generate Google Slides from Google Sheets with AI. If your workflow starts in Excel and ends in PowerPoint, see Generate PowerPoint from Excel with AI.
Step 2: Choose the presentation style
If you already have a deck with the branding, typography, layout, and overall look you want, upload it as the reference. Slideform can use that presentation as the visual reference for the new output.
If you do not have a deck yet, you can ask Slideform to create a new design. For example, you might ask for a clean executive reporting style, a client-facing agency report, or a more visual research presentation.
If your team already has a deck style you like, use that as the design reference. If you are starting fresh, Slideform can help create a new design. For the full template workflow, see our guide on creating a presentation template with AI.
Step 3: Ask Slideform to analyze the spreadsheet
Next, ask Slideform to inspect the spreadsheet and decide what should go into the deck. Be specific about the audience and the kind of report you want.
"Analyze this Supermetrics export and create a client-facing paid media performance deck. Include spend, conversions, CPA, ROAS, top campaigns, and recommendations for next month."
"Create an executive summary from this financial workbook. Focus on revenue, margin, expense changes, and anything that needs leadership attention."
"Turn this survey spreadsheet into a research presentation with the main findings, segment differences, charts, and recommended next steps."
This is the step where the spreadsheet becomes the source material for a story, not just a table of numbers.
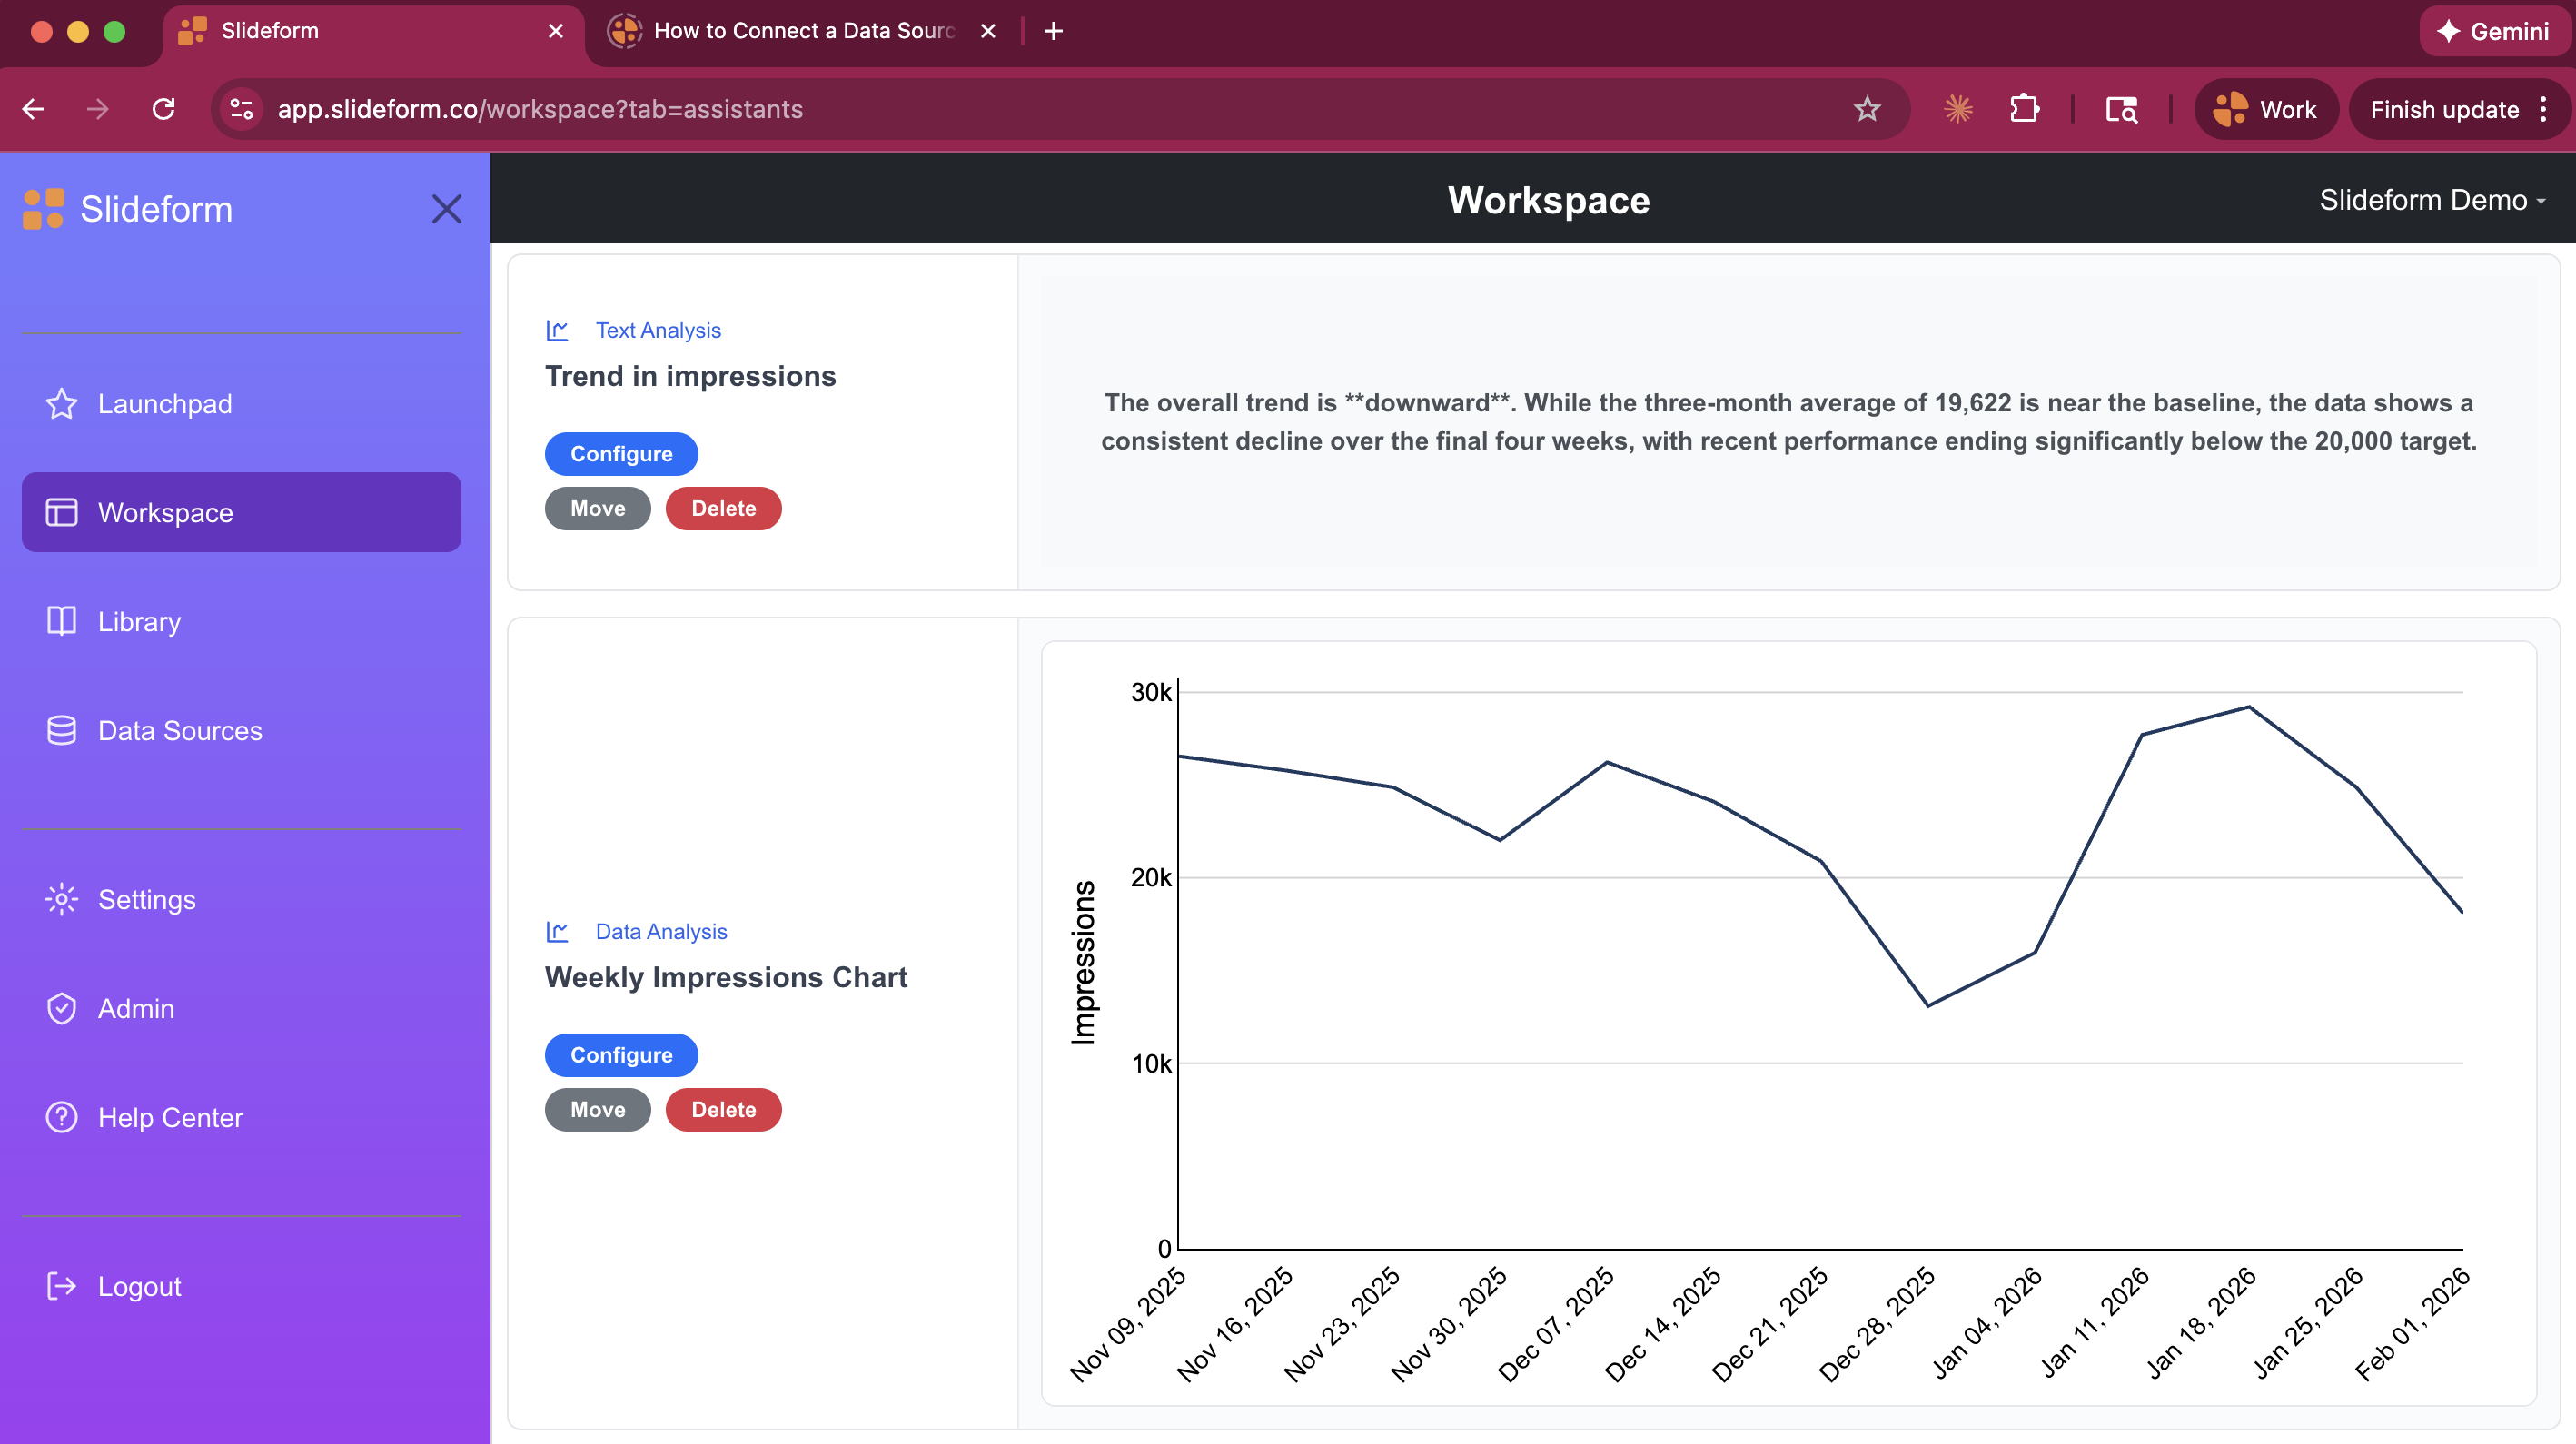
Step 4: Review charts, tables, and written insights
Once Slideform understands the data, review the pieces it creates for the presentation. That might include KPI cards, trend charts, category comparisons, ranked tables, short callouts, slide headlines, and executive summaries.
For a marketing spreadsheet, that might mean charts for spend, conversions, CPA, and top-performing campaigns. For a finance spreadsheet, it might mean revenue, expenses, margin, and month-over-month changes. For a survey spreadsheet, it might mean response breakdowns, segment comparisons, and top themes.
Charts are useful, but most presentations also need a point of view. A good prompt here is direct:
"For each slide, write a short headline that explains the takeaway. Do not just label the chart."
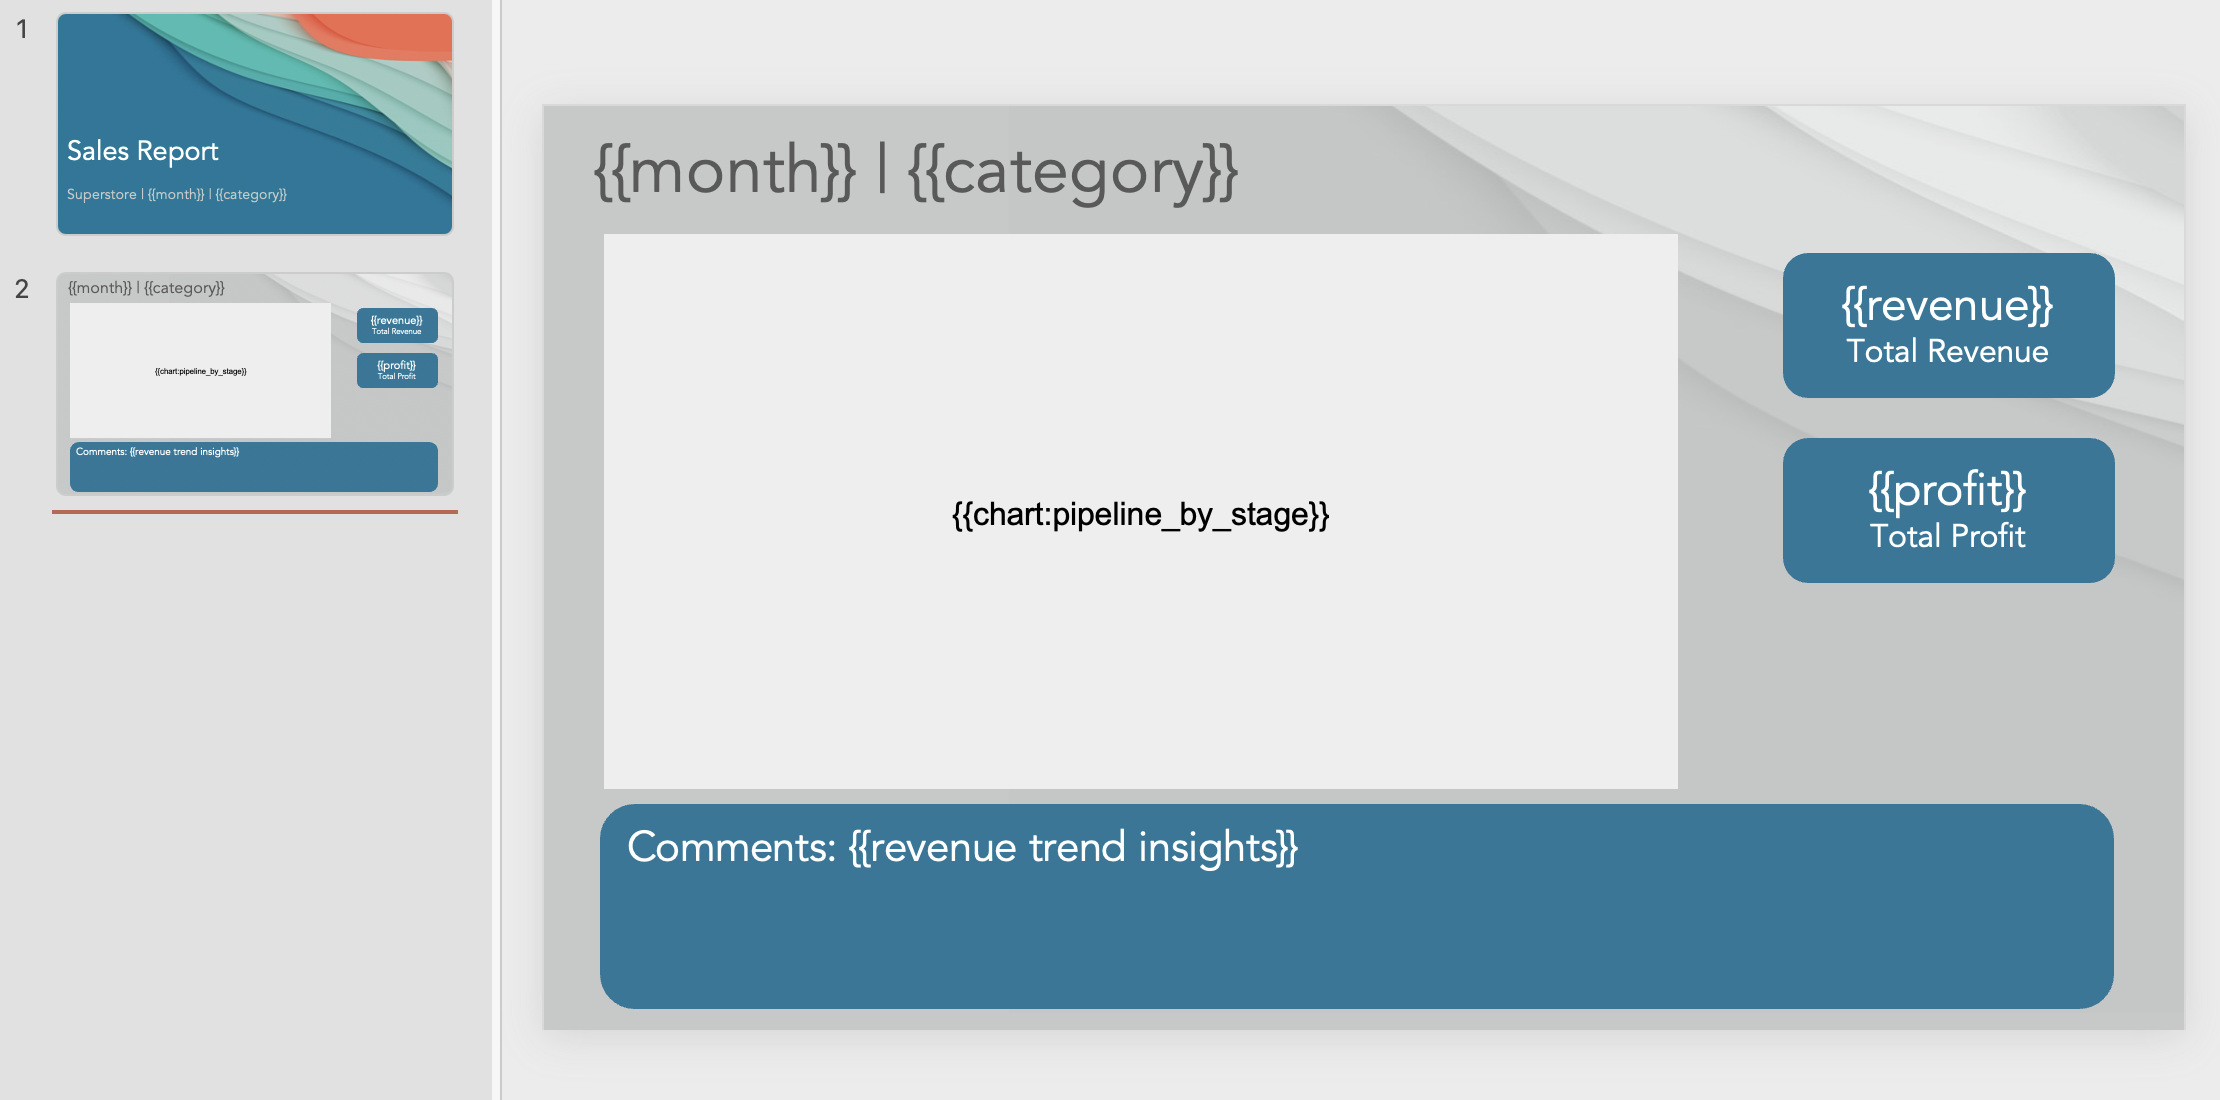
Step 5: Generate the presentation
After the analysis, charts, and copy are ready, generate the deck in Google Slides or PowerPoint. The output should feel like a presentation: title slide, summary, supporting charts, findings, and recommendations.
Who Can Use Slideform?
Marketing performance reports
Use a Supermetrics or ads-platform export to create a deck about spend, impressions, clicks, conversions, CPA, ROAS, and campaign-level recommendations.
Financial performance decks
Use a spreadsheet of revenue, expenses, and operating costs to create a monthly P&L deck with margin trends, cost drivers, and management notes.
Survey and research presentations
Use a survey export to create charts for response distributions, segment differences, top themes, and recommended next steps.
Sales and customer reports
Use pipeline exports, customer health spreadsheets, or product usage data to create account reviews, forecast updates, or customer success decks.
Frequently Asked Questions
Can AI create a presentation directly from a spreadsheet?
Yes. Connect the spreadsheet, choose or upload a presentation style, ask Slideform to analyze the data, and generate the deck in Google Slides or PowerPoint.
Can this work with both raw data and pivot tables?
Yes. You can start from raw exports, such as Supermetrics or CSV data, or from a workbook that already includes pivot tables, cleaned tabs, formulas, and summary views.
Can this work with Google Sheets and Excel?
Yes. The same workflow can apply to Google Sheets, Excel files, CSV exports, and other spreadsheet-style reporting inputs.
Will Slideform only summarize the data, or can it create charts too?
It can do both. Slideform can generate charts, tables, metrics, slide headlines, written takeaways, and recommendations from spreadsheet data.
Can I use my own deck as the design reference?
Yes. If you already have a branded deck, upload it so the new presentation follows that style. If you do not have one, Slideform can create a new design.
Turn Your Next Spreadsheet into a Presentation
If your spreadsheet already has the data for the report, the next step is turning it into something people can read quickly. Connect the spreadsheet, choose the deck style, ask Slideform for the analysis, and generate the slides.
See what Slideform can do for you
Get full access to Slideform with a free trial. No credit card required.