You can use AI to create a presentation template for recurring reports by defining the structure you want, adding placeholders for dynamic content, connecting live data, and generating branded Google Slides or PowerPoint outputs on demand or on a schedule. With Slideform, the goal is not just to make one nice-looking deck. It is to build a reusable reporting template your team can run again and again.
Most teams do not struggle with making one presentation. They struggle with making the same presentation every week or month without rebuilding layouts, rewriting summaries, and reformatting charts from scratch. That is why reusable templates matter so much in reporting workflows.
GOAL: Create a branded presentation template with AI that can be reused across clients, teams, or reporting cycles while staying consistent in layout, style, and delivery.
What is Slideform?
Slideform is the AI Analyst for business analytics and reporting. It helps teams connect dashboards, spreadsheets, CRMs, and other business data to branded outputs like Google Slides, PowerPoint, PDF reports, emails, and dashboards.
Why Reusable Presentation Templates Matter
If your team creates recurring reports, the deck itself is only part of the work. The harder part is keeping the presentation consistent while the numbers, charts, dates, and commentary change every cycle.
Without a reusable template, the workflow usually looks like this:
- Copy an old deck.
- Replace the client name, date range, and summary text.
- Rebuild or reinsert charts.
- Fix spacing, fonts, and colors.
- Repeat the same cleanup next week.
A strong presentation template solves that problem by separating what should stay fixed from what should refresh: brand styling, slide layouts, typography, section structure, and dynamic placeholders for KPIs, charts, tables, and written insights.
What a Good Report Template Includes
1. A clear reporting structure
A good template should already define the flow of the presentation, from the title slide and executive summary to KPI snapshots, trend charts, supporting detail slides, and recommendations. AI can help create this structure up front so the deck feels intentional before any live data is inserted.
2. Reusable placeholders
Placeholders tell Slideform what parts of the presentation should update later.
These are what turn a static slide deck into a working template.
3. Branded design choices
The template should capture your fonts, color palette, slide backgrounds, chart styling, spacing, layout, and heading hierarchy. If you define the style once, the output stays much more consistent later.
4. Room for data-driven content
Templates work best when they are designed around the kinds of outputs you plan to generate, such as KPI cards, native charts, tables, insight boxes, comments, or narrative sections.
Can Generic AI Slide Tools Do This Well?
There are plenty of AI design tools that can generate a presentation from a prompt. But creating a reusable reporting template has different requirements than making a one-off deck.
What generic AI slide generators do well
Tools like Gamma, Canva AI, and similar presentation makers can be useful when you want a quick first draft, a one-time presentation, new design ideas, or a deck generated from text or notes.
Where they usually fall short
Recurring reporting templates need structured placeholders, a stable layout for refreshes, data mapping to live sources, consistent chart placement, and scheduled regeneration.
Bottom line: they can help you create slides, but they are not built to create reusable reporting templates connected to live data.
This Is Where Slideform Comes In
Slideform helps you create a presentation template with AI in a way that supports the full reporting workflow later.
- Define the report structure.
- Create the slide layouts and design direction.
- Add placeholders and pragmas for dynamic content.
- Connect the template to live data.
- Generate recurring outputs from the same template.
That means one template can support dozens or hundreds of future reports without losing your formatting or brand standards.
How to Create a Presentation Template with AI
Step 1: Define the job the template needs to do
Before designing slides, decide what the recurring report is for. This might be a client QBR, executive business review, sales pipeline update, marketing performance report, or customer success scorecard.
Step 2: Ask the AI Analyst to design the slide structure
"Create a client reporting template with a title slide, KPI overview, trend charts, account highlights, and next steps."
"Design a weekly sales report template with room for pipeline KPIs, forecast commentary, top deals, and rep performance charts."
"Create a monthly marketing report template with an executive summary, channel performance section, campaign highlights, and recommendations."
Step 3: Set the visual direction
You can create the template design from scratch with AI, or guide it with specific instructions around preferred colors, font style, layout density, tone, slide count, KPI cards, sidebars, or commentary blocks.
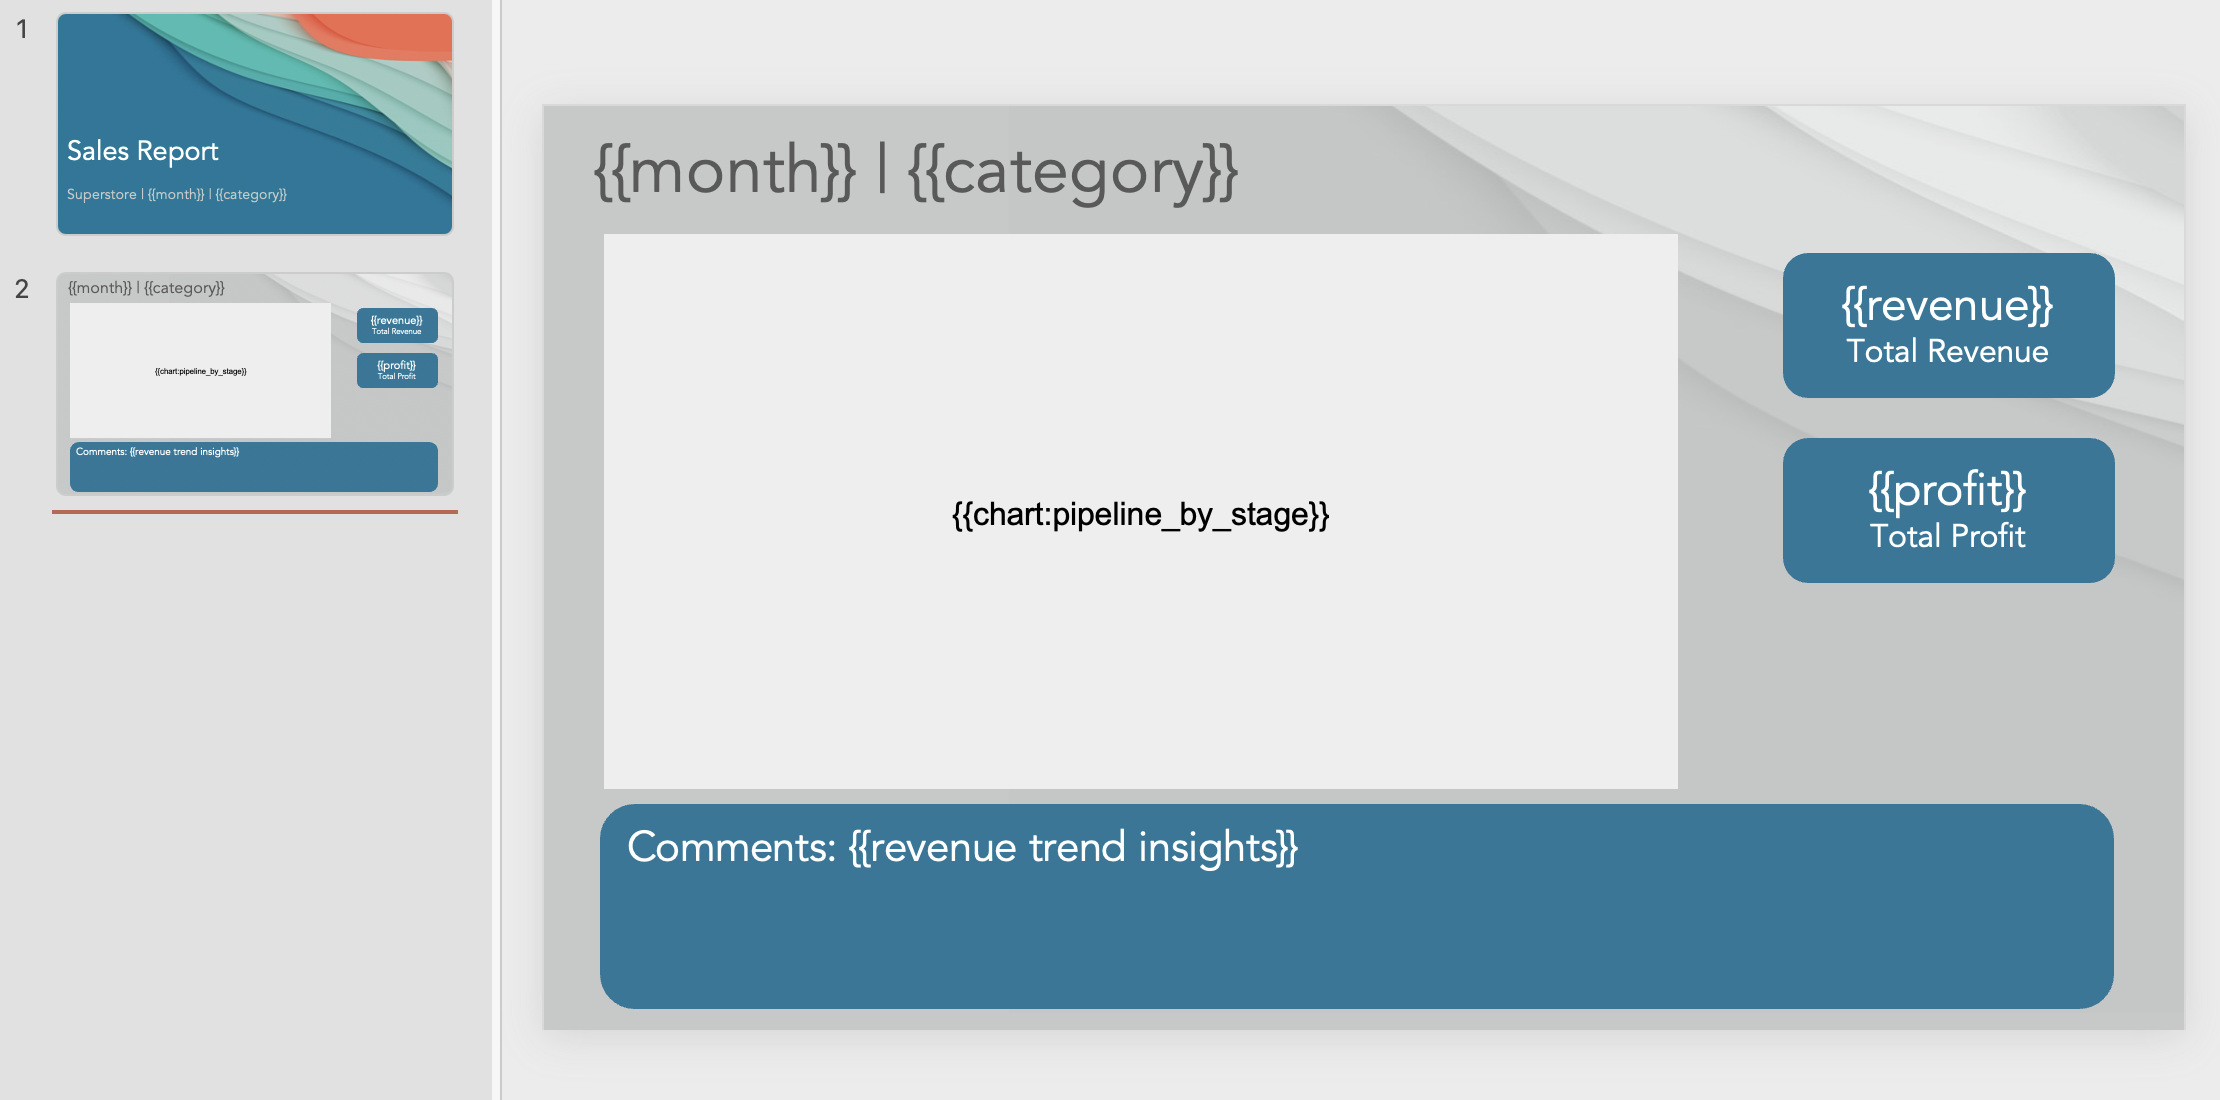
Step 4: Add placeholders and pragmas
Replace content that should refresh later with placeholders such as {{client_name}}, {{reporting_period}}, {{total_revenue}}, {{chart:revenue_by_channel}}, {{data:top_opportunities}}, or {{executive_summary}}.
You can also use pragmas and other template logic to control how repeated or conditional content behaves across the deck.
How Placeholders and Pragmas Work
Think of placeholders as named slots in the presentation. When the AI Analyst or a connected data workflow creates content, Slideform can map the output into the correct slot.
- Text placeholders for names, dates, summaries, and single metrics
- Chart placeholders for saved visualizations
- Data placeholders for structured tables and lists
Pragmas and template rules help control repeated patterns, formatting behavior, and logic that should stay stable from one output to the next.
Step 5: Connect a Data Source and Map Content
Once the template structure is ready, connect the data source that will supply the live content. This might be Google Sheets, Excel, Looker Studio, Tableau, Power BI, Sigma, HubSpot, Salesforce, a database, or a warehouse.
Then map the generated content to the placeholders in the deck.
- Revenue KPI to
{{total_revenue}} - Monthly trend chart to
{{chart:revenue_by_month}} - Account summary text to
{{executive_summary}}
Step 6: Schedule the Output
After the template and mappings are working, you can decide how the final reports should run.
- On demand
- Weekly
- Monthly
- One version per client or account
- One version per team or region
This is where AI template creation becomes much more valuable than one-off slide generation. You are building a reusable reporting system.
Best Practices for Template Governance
Keep one approved template per workflow
Avoid creating slightly different versions of the same report unless there is a real business reason. Too many template variations make maintenance harder.
Name placeholders consistently
Use predictable names like {{total_revenue}}, {{chart:revenue_by_channel}}, and {{data:top_accounts}}. Consistency makes mapping easier and reduces confusion later.
Separate template design from report content
Do not hardcode data-specific commentary into the template if it should be regenerated each cycle. Save those areas for dynamic summaries.
Review the template before scaling
Before running dozens of outputs, verify spacing, placeholder behavior, chart sizing, font consistency, and export readability.
Who This Is Best For
Agencies
Build one client-reporting template and reuse it across many accounts with new branding fields, charts, and commentary each cycle.
Customer success teams
Create repeatable QBR and EBR templates with standard sections for outcomes, health metrics, risks, and next steps.
RevOps and sales teams
Design templates for pipeline reviews, forecast updates, rep scorecards, and executive summaries.
Marketing teams
Set up recurring performance templates for campaign results, channel reviews, and client updates.
Frequently Asked Questions
Can I create a PowerPoint template with AI?
Yes. Slideform can support recurring template workflows for both PowerPoint and Google Slides.
Can I create a Google Slides template with AI?
Yes. You can design a new Google Slides template with AI, add placeholders, and connect it to live data for future runs.
What is the difference between a template and a finished presentation?
A finished presentation is one specific output. A template is the reusable framework that defines layout, style, and placeholder structure for future outputs.
Do I need live data before creating the template?
Not always. You can create the structure and design first, then connect the live data and mappings afterward.
Can I use an old deck instead of starting from scratch?
Yes, but that is a slightly different workflow. For that use case, see the companion post on turning an existing deck into a reusable template with AI.
Related Guides
- Slideform AI Analyst for Presentations, Charts, and Insights
- Turn an Existing Deck into a Reusable Template with AI
- Create and Update PowerPoint Presentations with AI
- Create and Update Google Slides Presentations with AI
- Generate PowerPoint from Excel with AI
Build Your First Template in Slideform
If your team is still copying old decks, replacing labels manually, and fixing the same layout issues every reporting cycle, this is a better way to work.
A reusable AI presentation template gives you a repeatable reporting structure before the data changes, so your final presentations can stay faster, cleaner, and more consistent.
See what Slideform can do for you
Get full access to Slideform with a free trial. No credit card required.