Streamline Looker Studio to Slides
If you need to change the colors or styling of one of the charts in Looker Studio for a client report, it can be really difficult to accomplish. Maybe you don't have access to edit Looker Studio, or you don't want to make changes that are visible to other users. Now, you can use Slideform's AI assistant to create new content from your data without touching Looker Studio.
Use Slideform to embed Looker Studio visuals into Slides, and even add new charts and insights from your Looker Studio data.
Slideform eliminates repetitive reporting work. Whether you're generating client performance reviews, campaign summaries, or internal team updates, Slideform's AI agent can connect directly to your Looker Studio dashboards and generate dynamic reports on-demand or on a schedule.
In this post, we’ll break down how the Slideform AI agent works with Looker Studio, how it differs from other AI tools, and how to set it up in just a few steps.
What is Slideform?
Slideform is an AI-enabled automation platform that links data from BI dashboards to reports, slides, and documents. You use your own template, and Slideform fills in the data. Automation is especially useful for reports that you create on a recurring basis each month or week.
AI-powered Reporting is a Productivity Superpower for Looker Studio
Looker Studio is a popular dashboard platform, but getting your data into formatted, client-ready presentations often remains a manual and time-consuming process.
Slideform's Looker Studio-compatible AI Agent solves this by automating:
-
Data collection – pulling charts, KPIs and tables directly from Looker Studio
-
Visualization – creating new charts from Looker Studio data
-
Analysis – generating insights and summaries from Looker Studio data
-
Formatting – inserting updated content into slide and report templates
-
Delivery – generating reports at scale, even across hundreds of accounts
With Slideform's AI agent, your team can reclaim hours each week, ensure accuracy, and maintain consistency across all reports—without dashboard-to-slides friction.
Slideform can create either Google Slides or PowerPoint. For PowerPoint-specific examples, check out How to Integrate Looker Studio with PowerPoint.
Comparison with Gemini, ChatGPT and Existing Tools
There are a few ways teams try to solve the Looker Studio to Slides reporting problem today:
| Method | Feasibility |
|---|---|
| Manual screenshots | From Looker Studio, you can export a chart to image or PDF, or use a screen capture tool. Then insert the image into the slides. This approach is time-consuming, and often misaligned with brand guidelines. |
| Gemini plugin for Looker Studio | You can embed Looker Studio content (chart or table) as a Linked Object in Google Slides. This may work for simple use cases, but this approach has limitations. It is not designed to switch between multiple clients or filters, there is no auto-update or scheduling functionality, and it cannot embed text or numeric values. |
| ChatGPT | ChatGPT cannot connect to Looker Studio. You would have to export the data and re-create the charts manually. ChatGPT can create simple PowerPoint slides for you, but the results vary. |
By contrast, Slideform's AI integration with Looker Studio offers the best of all worlds:
-
Direct Looker Studio integration with real-time data pulls
-
Templated, branded output in slide or document form with minimal effort
-
Can be triggered via Slideform app, API, or schedule
-
Handles chart rendering, text summaries, and layout placement automatically
-
Easily scaled—generate dozens or hundreds of customized reports at once
This approach is purpose-built for teams that need repeatable, structured, and client-ready reports, not just internal dashboards or AI "insights".
What does Slideform's Looker Studio AI Agent do?
Slideform is designed especially for reporting, not chatting or answering customer service questions. It handles templating, scheduling, and formatting while staying tightly integrated with your Looker Studio. Here's what it does under the hood:
-
Connects to Looker Studio: Slideform securely connects to your Looker Studio to pull live data. Slideform's scope is limited to read-only access. It can fetch all the charts, tables, scorecards, maps, and the data behind them, but it doesn't have the ability to edit the data in Looker Studio. It does not use an MCP server for Looker Studio, but instead has a proprietary integration custom-built for Looker Studio.
- Performs analysis: Query, filter, and perform operations over your data using natural language prompts. For example, you can ask the agent to identify trends in the data, summarize the data by client or category, or generate bullet points to summarize a chart.
-
Creates visuals: The Slideform analyst can create new tables, charts, and time-series graphs from your data using a prompt. The visuals can be formatted, colored, and resized to match your branding. Slideform does this by writing and executing a custom Python script to process and chart your data for you. Just ask it to create a chart and watch it go to work for you. Once the chart is done, you can embed it into a report.
- Maps data to templates: You define a presentation or document template (e.g. Google Slides or PowerPoint) using placeholders like
{{sessions}}or{{chart:revenue_per_channel}}. The agent replaces these dynamically with data, text, charts, or tables. -
Scales across clients or teams: The same template can be reused with different filters—for example, by client, region, or category—making bulk reporting fast and consistent.
-
Enables scheduled and on-demand reporting: Generate a deck instantly, or set it to refresh and deliver on a set schedule.
This level of automation goes beyond typical AI chatbots and text summaries. It's closer to having a full-time reporting assistant who never makes a mistake and never misses a deadline.
Example Use Cases
Slideform's AI agent for Looker Studio reporting isn’t just a timesaver—it transforms how teams create, distribute, and scale their reporting operations. To create a new metric or chart, just enter a simple prompt. Then, use the Slideform interface to match that element to a placeholder in your slide deck template. Here are a few examples:
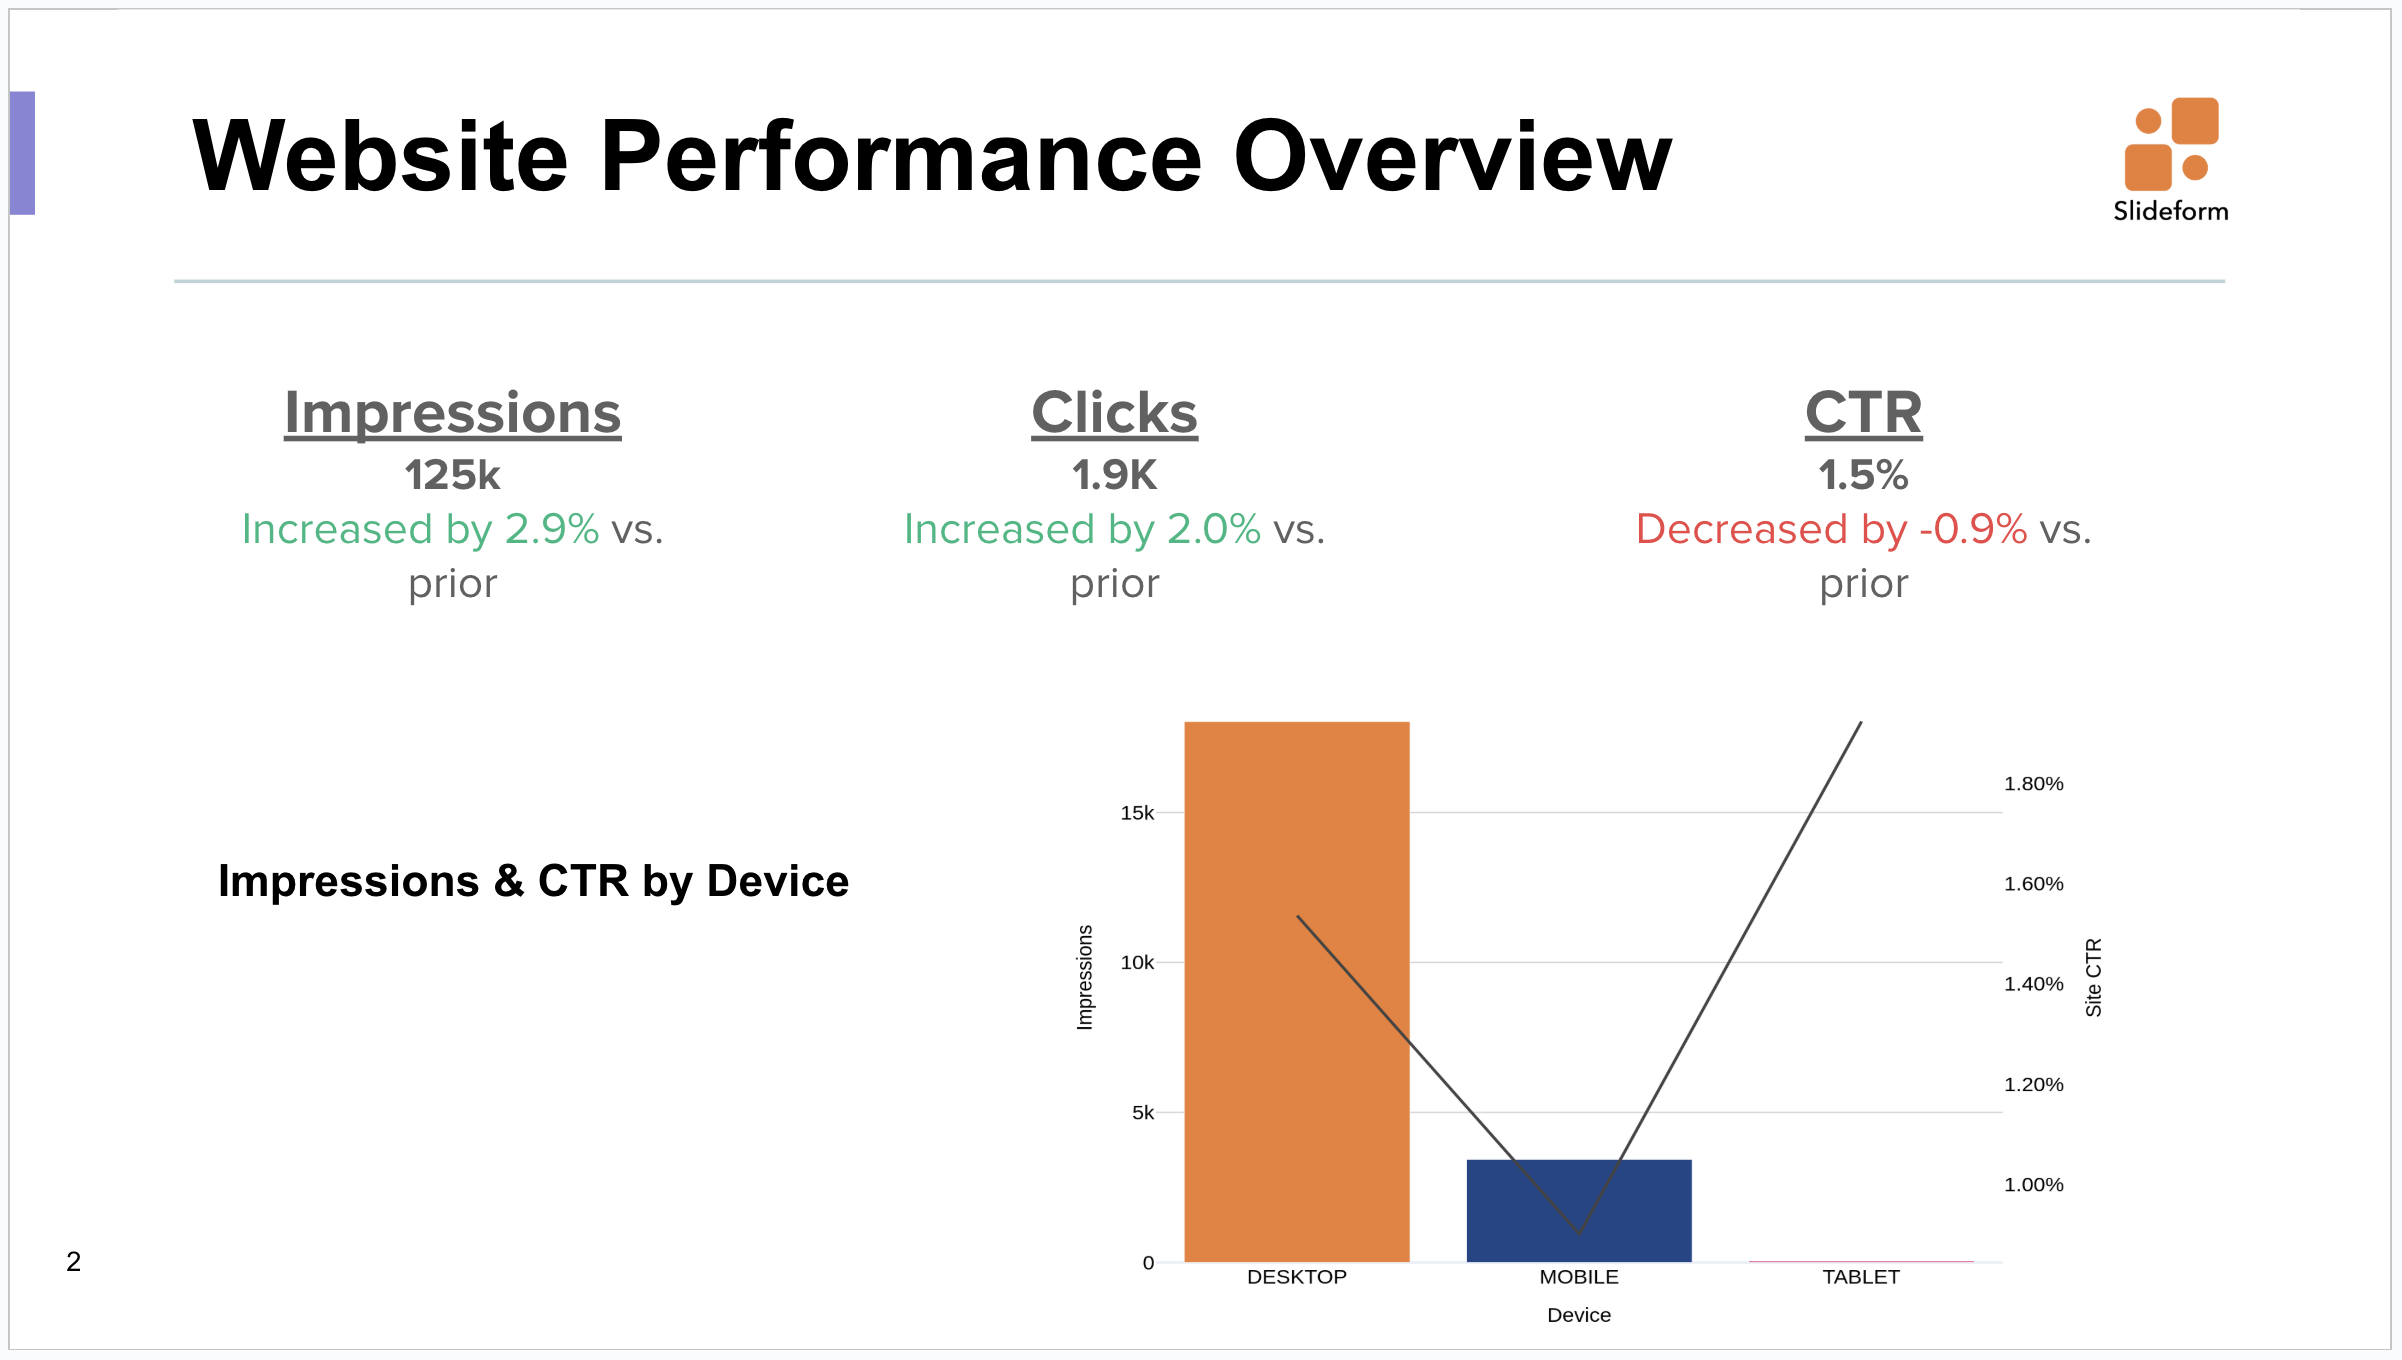
Monthly Client Analytics Report: Deliver scheduled reports showing KPIs like Impressions and CTR, filtered to a specific client and date range, directly from Looker Studio.
Slide template: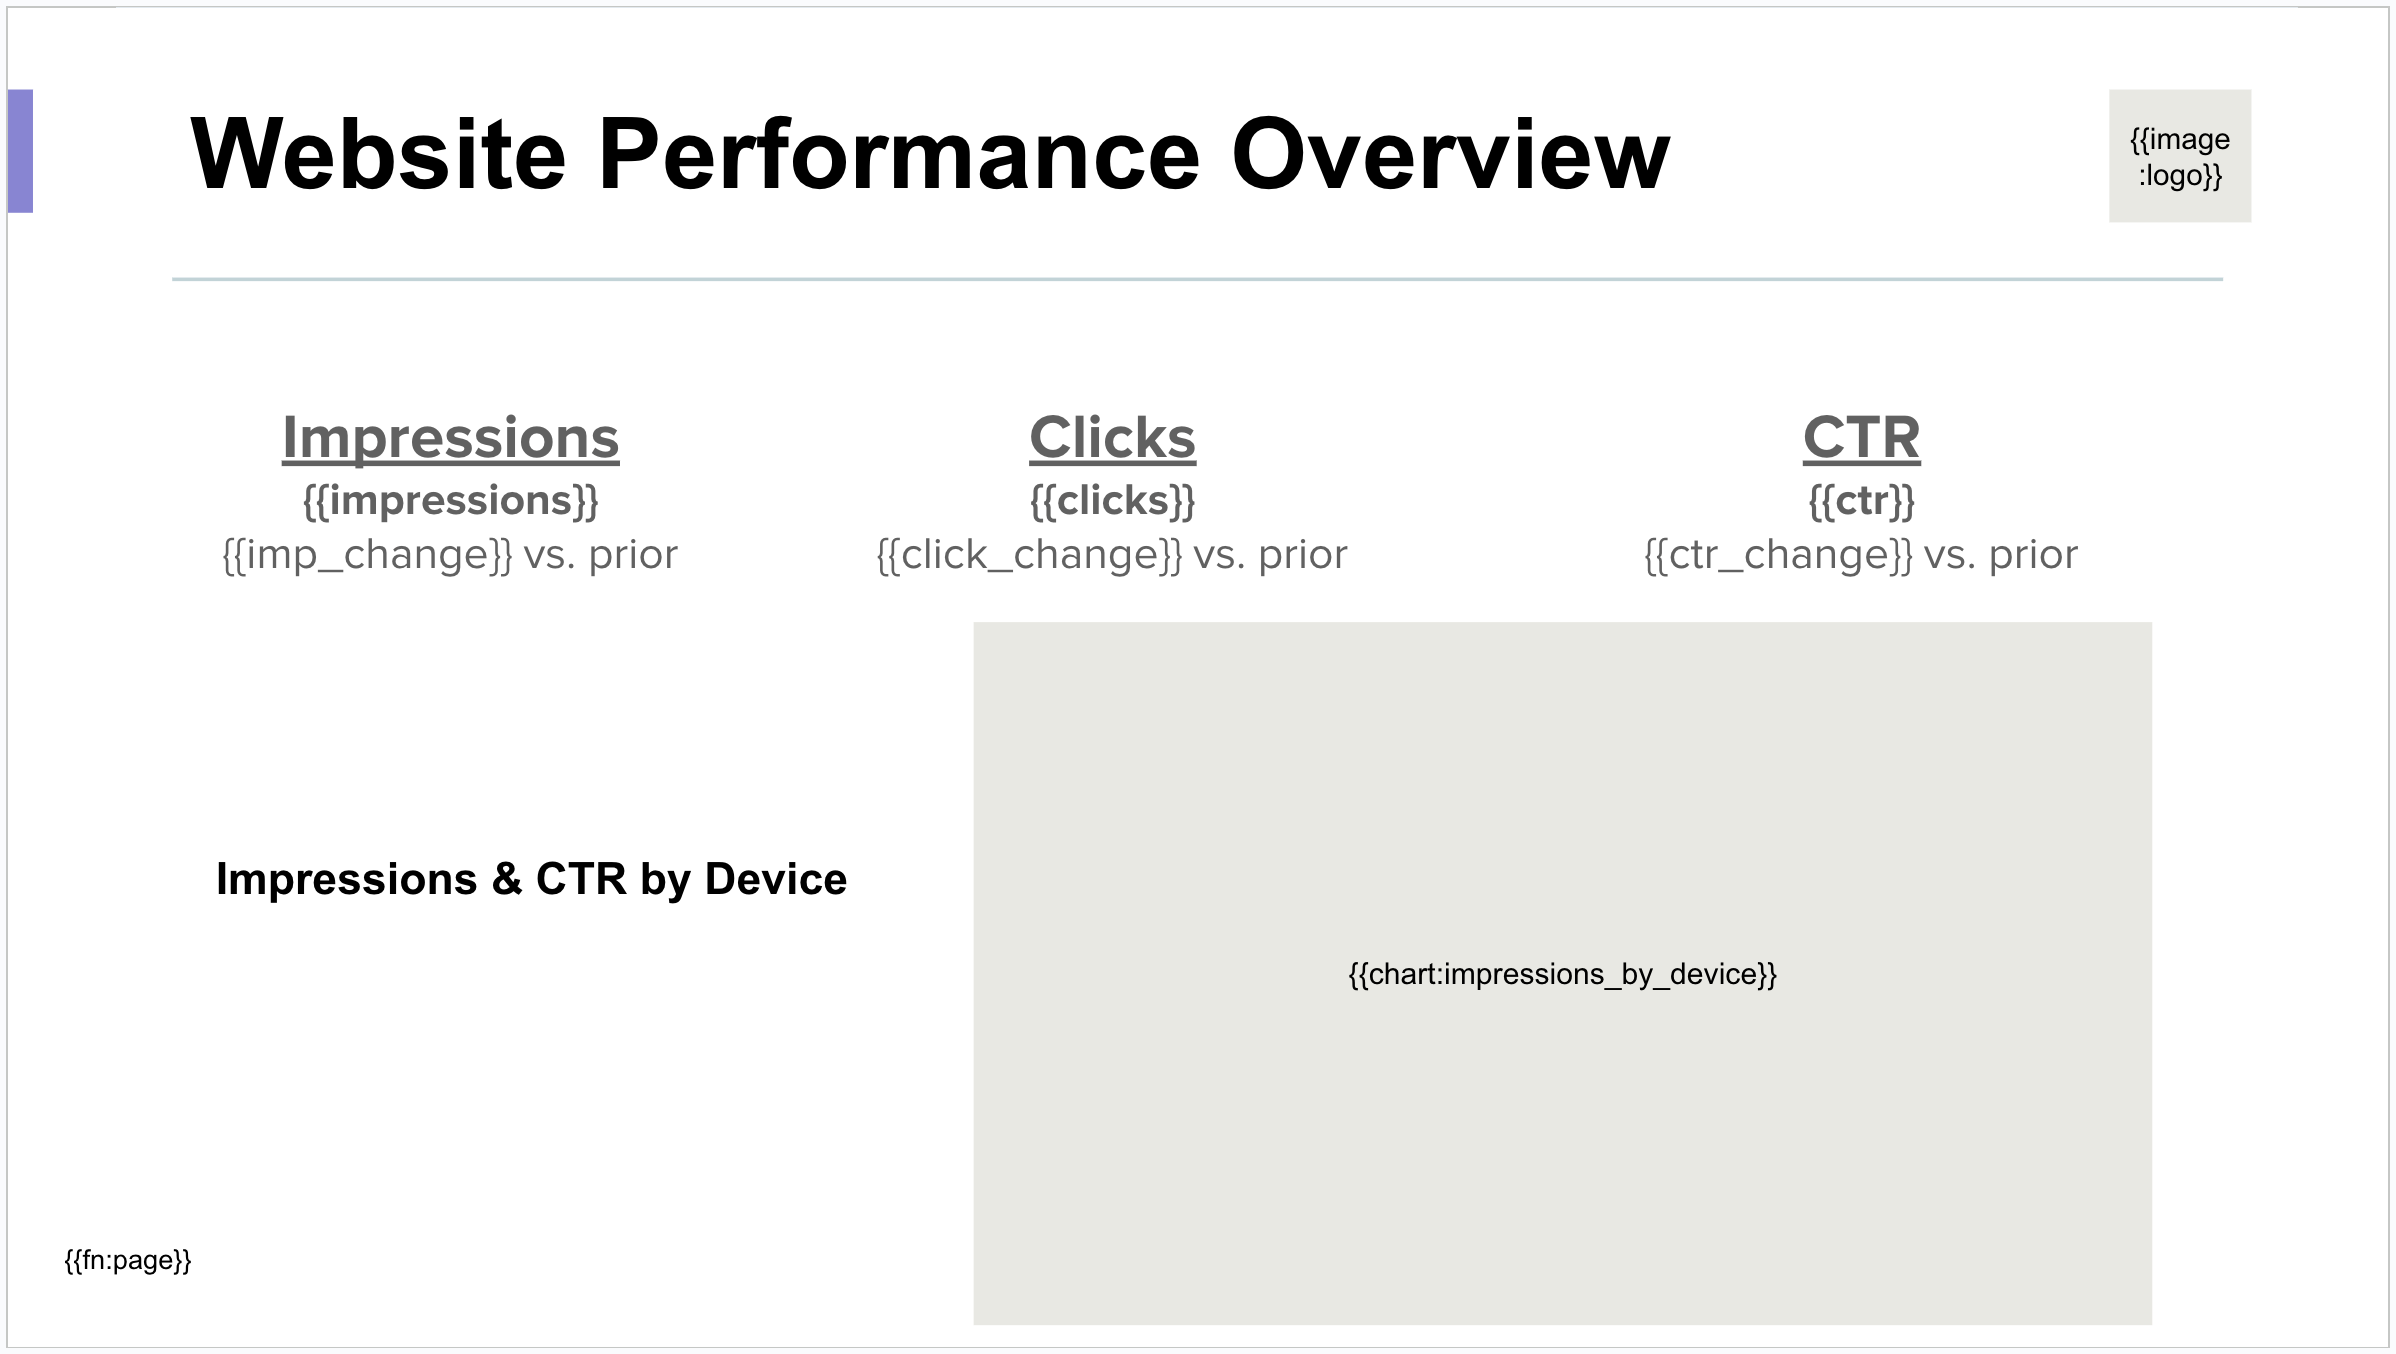
Change in a value compared to prior period
- Placeholder: {{click_change}}
- Pull the value from Looker Studio. Change the text color and add the words "Increased by" or "Decreased by" depending on the change value.
Make a new chart with new colors and styling
- Placeholder: {{chart:impressions_by_device}}
- Prompt: "Create a column chart of the number of impressions and the Site CTR for each device type. Device should be on the x-axis. Show the Impressions on the left y-axis and CTR on the right y-axis. Show the CTR line in black."
Slide output:
Other Use Cases -->
-
Client QBRs: Automatically generate quarterly business review decks using live Looker Studio data, customized for each client’s industry, performance, and goals.
-
Sales Enablement: Create personalized pitch decks based on a prospect’s activity, lifecycle stage, and opportunity history—without sales reps needing to touch Looker Studio.
-
Internal Updates: Provide internal teams with timely, automated reports highlighting KPIs and operational milestones.
Key Benefits of a Dedicated Looker Studio AI Agent:
-
Time savings: Eliminate the hours spent copying data and formatting slides.
-
Consistency: Standardize reports across clients, teams, or regions with templated output.
-
Accuracy: Pull live data directly from Looker Studio—no risk of outdated screenshots or missed metrics.
-
Scale: Automate 10 reports or 1,000 without adding headcount.
-
Brand control: Every report aligns to your company’s style guide, fonts, and color palette.
These improvements are especially impactful for agencies, consultants, or RevOps leaders who are constantly churning out reports—but anyone who uses Looker Studio data for communication will benefit.
Getting Started
Setting up Slideform for Looker Studio reporting is easier than you might expect. Here’s what you need:
🔗 1. Connect to Looker Studio
Authorize Slideform access by sharing the dashboard with Slideform and enable embedding for the report. Enter the dashboard URL into Slideform. You control the scope and can revoke access anytime.
🧩 2. Create a Reporting Template
Use your existing Google Slides or PowerPoint deck as a starting point. Replace content blocks with placeholders like {{chart:impressions}}.
⚙️ 3. Map Looker Studio Data to the Template
Define which Looker Studio data should populate each placeholder. This might include:
-
Embed an existing chart from Looker Studio
-
Create new charts and tables with Slideform's AI Agent
-
Calculate bullet points or metrics (e.g. trend in impressions)
📅 4. Trigger Reporting
Choose how and when to run the report:
-
On-demand (via API or UI)
-
Scheduled (e.g. every Monday at 8am)
-
Bulk (e.g. generate 100 versions filtered by client or rep)
🔐 5. Consider Privacy and Security
Slideform uses secure token-based authentication and does not store your report data unless configured to do so. Additional privacy and security information can be found in the Slideform Trust Center.
Benefits of Automated Reporting with Slideform
With Slideform, your team can generate polished, data-driven presentations automatically. Slideform scales with the number of reports you make, and there's no limit to the number of users, data sources, or report templates you can add. You can reuse the PowerPoint or Google Slides decks that you already have, and it's easy to schedule updates and generate new Slides.
With Slideform, Looker Studio reporting doesn’t have to be a chore—automate it and focus on growing your success!