Updated October 31, 2025
Today let's talk about Slideform's most popular integration: Looker Studio dashboards!  Looker Studio, formerly Google Data Studio, is a low-cost, easy-to-use dashboard solution. Their pre-made templates make it super simple to create a dashboard for Google Ads, Google Search Console, YouTube and hundreds of other data sources.
Automating your Looker Studio to slides workflow can be difficult, especially if you have multiple clients and filters. The new Gemini Add-on in Looker Studio is a cool idea, but it falls short in terms of functionality.
Slideform is the best way to connect Looker Studio to Google Slides. You can embed charts, images, and visuals, as well as editable tables, and fill in text boxes. Combined with all of Slideform's advanced features, you can see why so many Looker Studio users choose the Slideform Integration.
In today's post, I'll demonstrate how the Looker Studio integration works. We'll pull Looker Studio charts and metrics into Google Slides, create customized visuals and insights with Slideform AI, and easily generate custom, recurring, reports from your dashboards.
Looker Studio and Looker are two different products, and Slideform integrates with both! If you want to embed Looker (Classic) visuals into your slide deck, check out this post.
Slideform also supports PowerPoint format. For details check out How to Integrate Looker Studio with PowerPoint.
Simple steps to integrate Looker Studio with Google Slides
- Connect your Looker Studio dashboard to Slideform
- Upload a slide deck template
- Create new visuals and insights with AI
- Match the Looker Studio content to your template
- Generate and save the output file
Step 1: Connect Looker Studio to Slideform
Slideform works by pulling in your entire Looker Studio dashboard and all elements (charts, scorecards, KPIs, tables, images, & filters) for use in your slides.
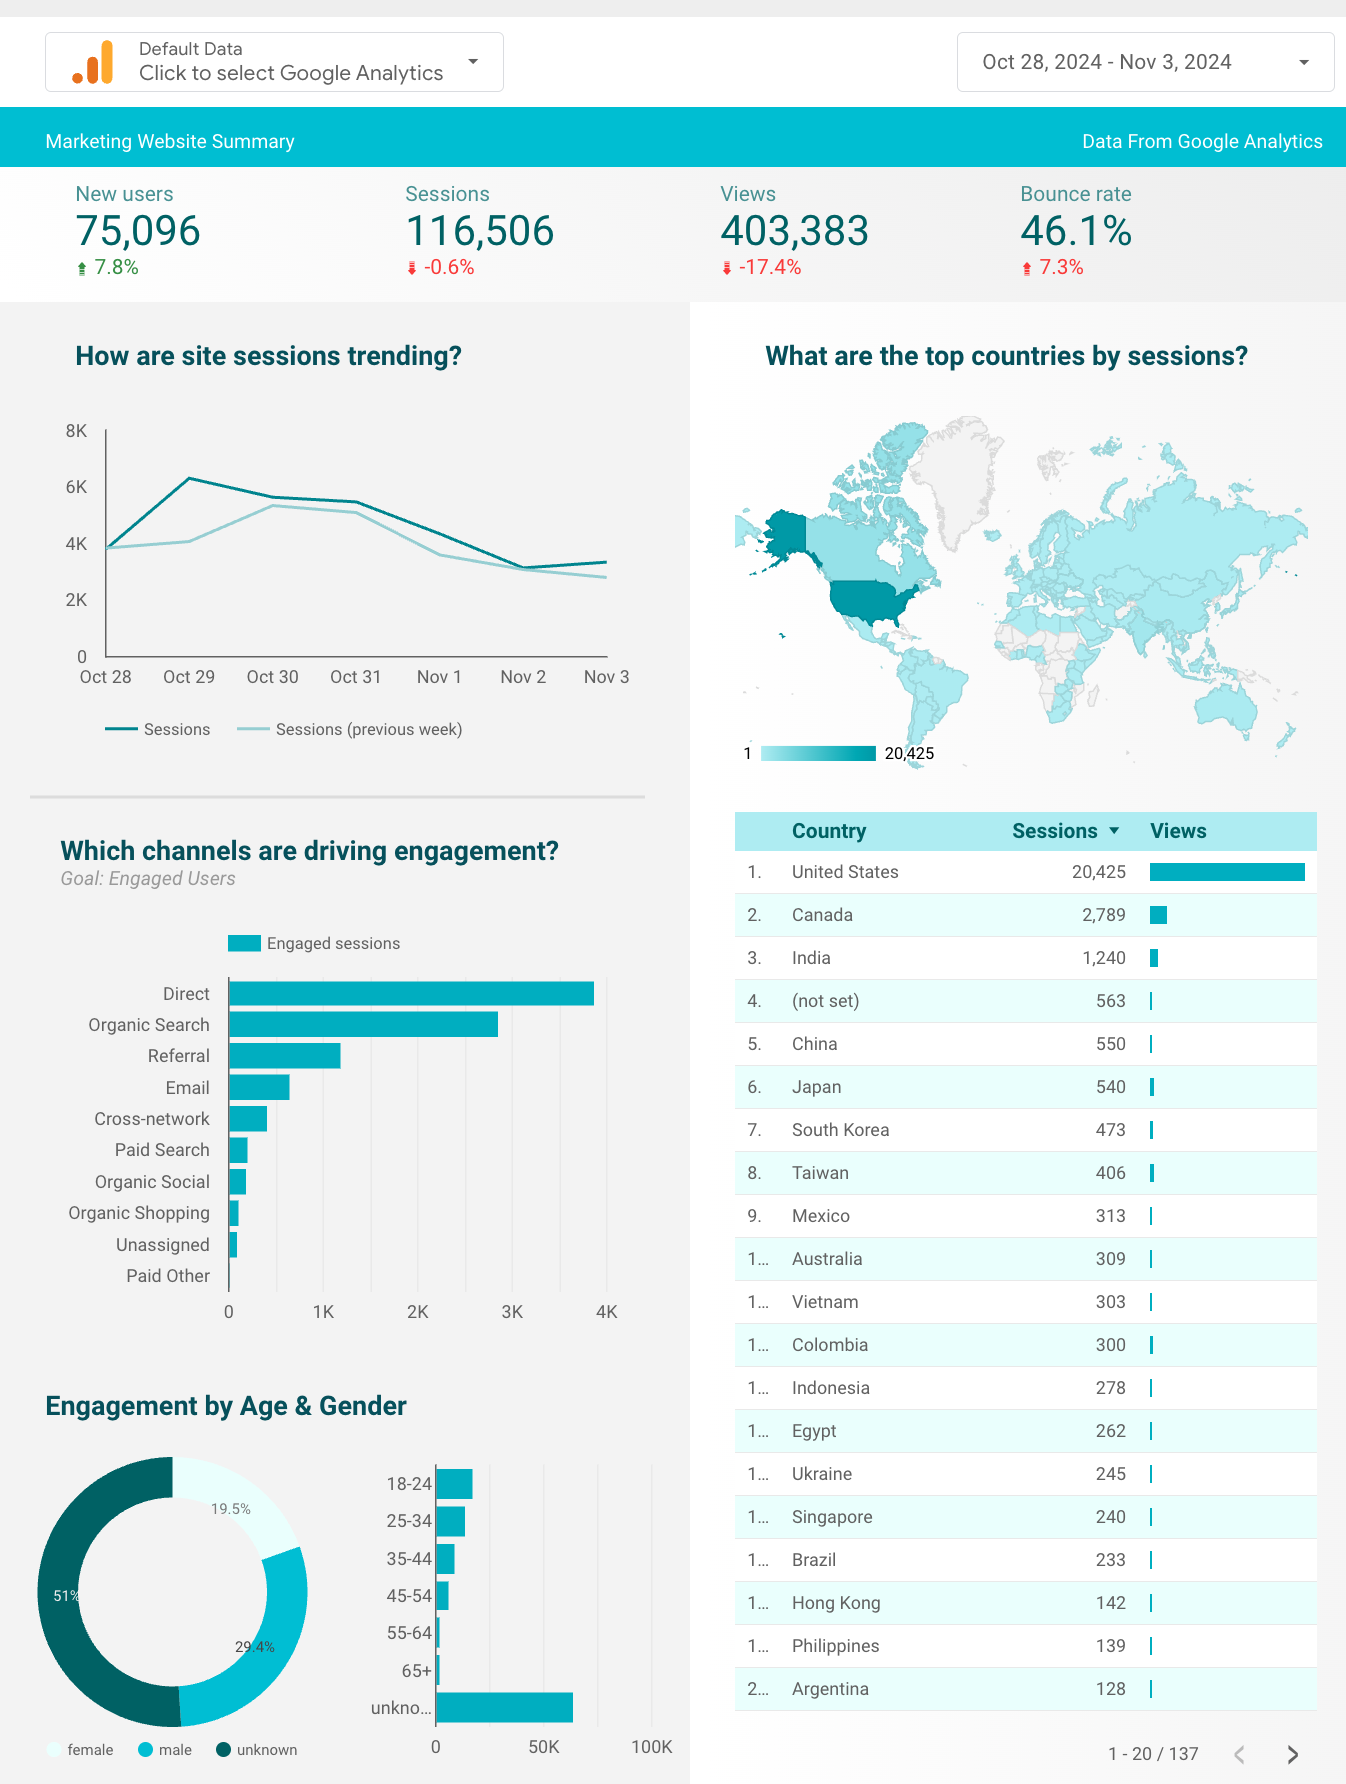
For example, let's look at a sample Google Analytics dashboard. Here is a view of the main dashboard page. I need to embed charts and metrics from this page into my monthly marketing report for each client.
1. To connect this dashboard to Slideform, first, log into Slideform and go to Data Sources > Add Data Source. Then under Looker Studio, click Add Integration.
2. Open your Looker Studio dashboard. Click Share and add viewer access for share@slideform.co. Make sure that Embed Report is enabled. Then just copy the URL of the dashboard into Slideform. Its super simple to set up, and you'll always have the latest data available for your reports! For more details on setup, see How to Connect A Data Source.
Step 2: Upload a slide deck template
Next, you need a template for your presentation. With Slideform, you can use your own custom-branded slides in the format of your choice, PowerPoint or Google Slides. Just start with a previous version of the presentation and insert placeholders (enclosed in curly braces) for any elements that will change between versions of the report, like text, numbers, images, charts, logos, and names. You can find a detailed explanation of the template in our Help Center.
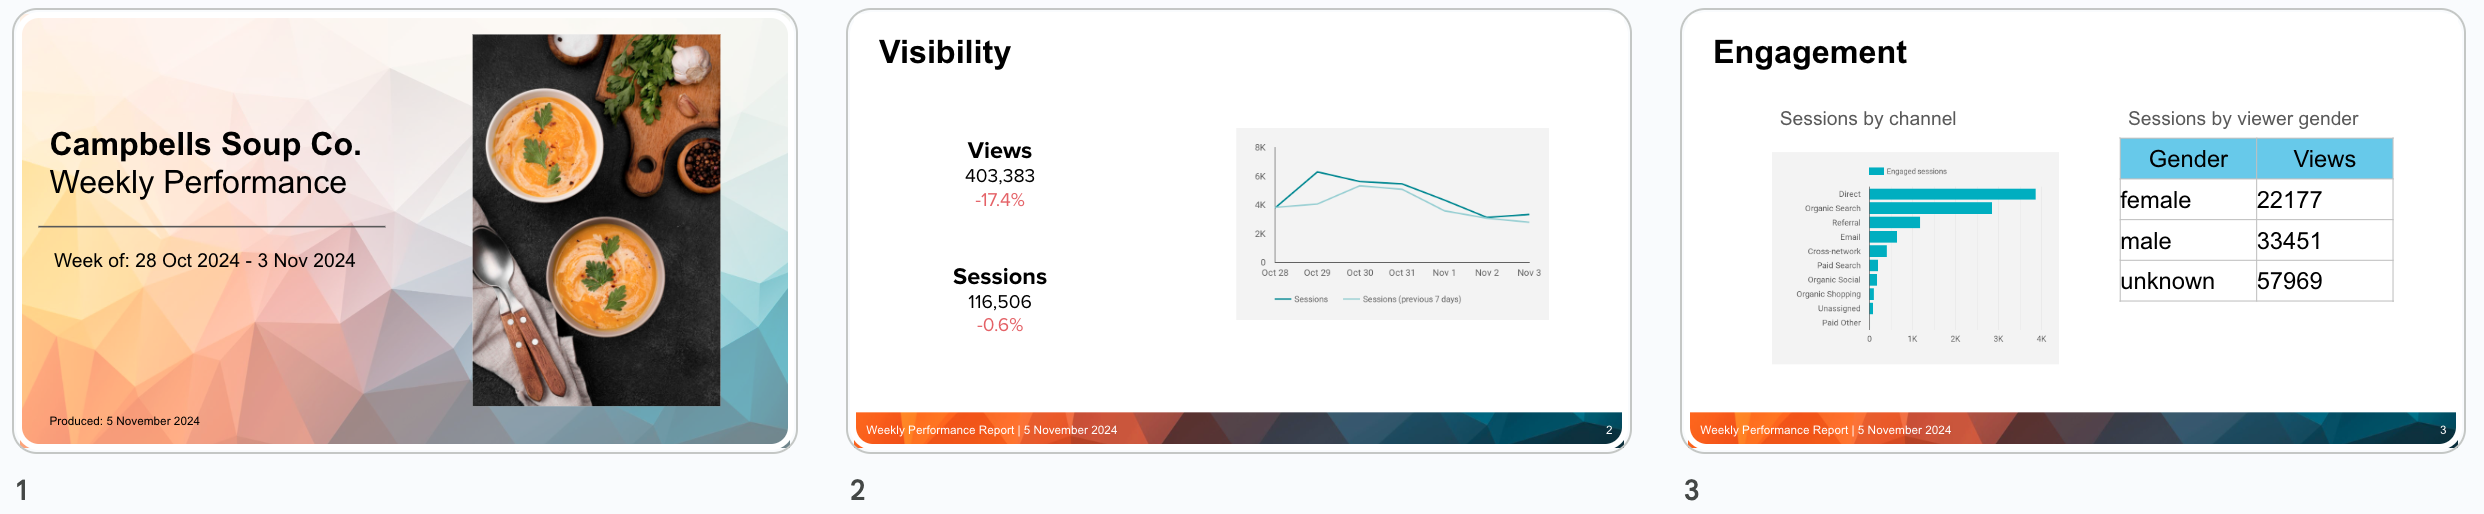
Here is a simple report template with placeholders for charts, numeric values (views and sessions), and a data table from my Looker Studio dashboard.
Sample Template
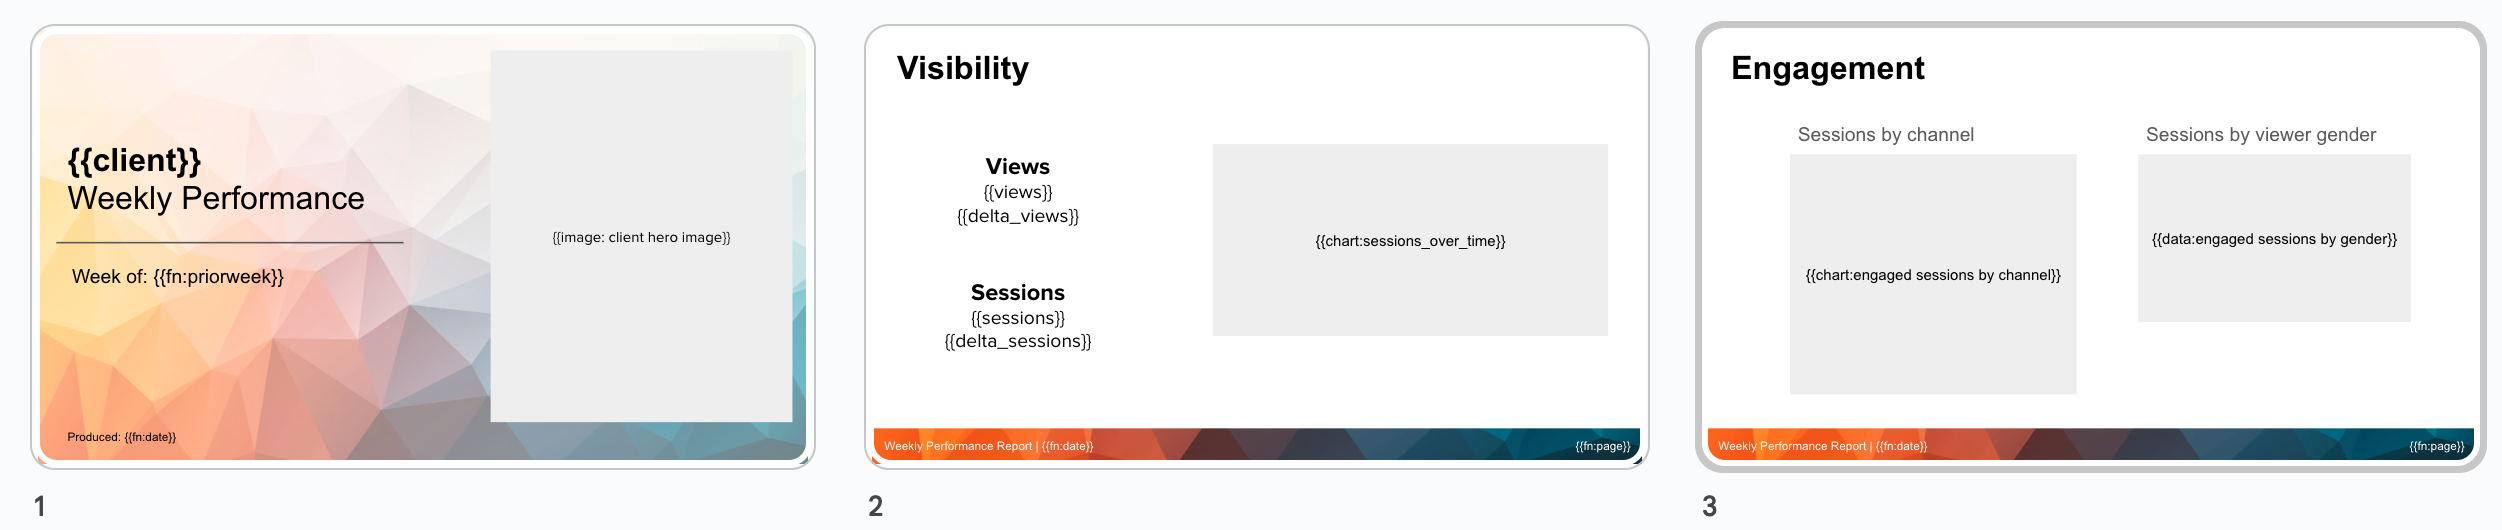
Placeholders are denoted by curly braces, and table or chart placeholders are contained inside shapes. The date range for the report is set to the Prior Week. All the colors, styling, fonts, and sizing of the elements in the template will be carried through to the slide deck output.
In Slideform, go to New Project to upload a slide template. Give your project a name and associate the Looker Studio data source. Remember to save your project!
Step 3: Create new visuals and insights with AI
If you need the change the colors or styling of one of the charts in Looker Studio for a client report, it can be really difficult to accomplish. Maybe you don't have access to edit Looker Studio, or you don't want to make changes that are visible to other users.
Now, you can use Slideform's AI assistant to create new content from the data in Looker Studio! With Slideform, you can create new, customized charts from your data. For example, let's take this default chart of impressions over time from Looker Studio.
Original Chart
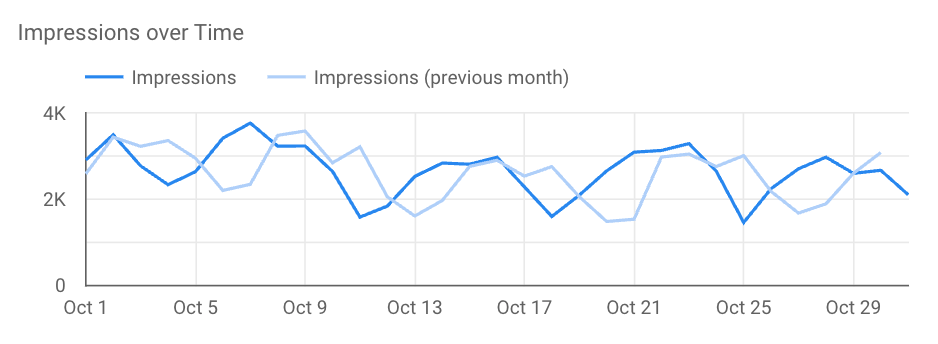
I want to change this to use the Slideform orange color scheme and to show the impressions grouped by week over a longer time range.
Just enter a prompt and create a new chart from the data in Looker Studio. My example prompt is:
Prompt: "Create a line chart of the number of impressions each week
over the past 3 months. Display the x-axis labels at an angle so
they do not overlap."
Since Slideform already has access to the Looker Studio data, it can write a custom charting script to operate over that data and produce a new chart. It also follows the branding and color preferences that I've set up in my account. Here's the new, improved chart:
New Chart

The new chart is uses my color scheme, it has the impressions data grouped by week and covers a three-month date range. This is exactly what I needed, and I didn't have to edit the original dashboard in Looker Studio. The best part is that this new chart is saved in my Slideform account so I can embed it in my reports. The chart will be updated with new data every time I run the report, and I don't need to enter the prompt again or do any manual formatting.
Generate insights and bullet points from Looker Studio
Slideform's AI can also produce text insights or calculations. For example, to include a bullet point in my report explaining any trends in the number of impressions per week, I might enter the following prompt:
Prompt: "Examine the number of impressions per week over the past 3 months.
Identify any upward or downward trends in the data relative to the
baseline expectation of 10,000 impressions per week."
The AI uses a custom script to analyze the data from Looker Studio and provides the answer in sentence form, such as:
Result: "Weekly impressions were above the 10,000 baseline each week and are trending downward for the past 1 week."
This text can then be embedded in one of the placeholders in the report template. The best part is, the text will be updated based on the data each time the report is generated!
With Slideform it's less "chatting" and more results. Custom charts & insights are saved, repeatable analyses that update whenever you run the report.
Step 4: Match Content to the template
Now, we need to match each placeholder in the slide template to the correct chart or other content that will fill it. Open the project for editing by clicking Configure Data on the project card.
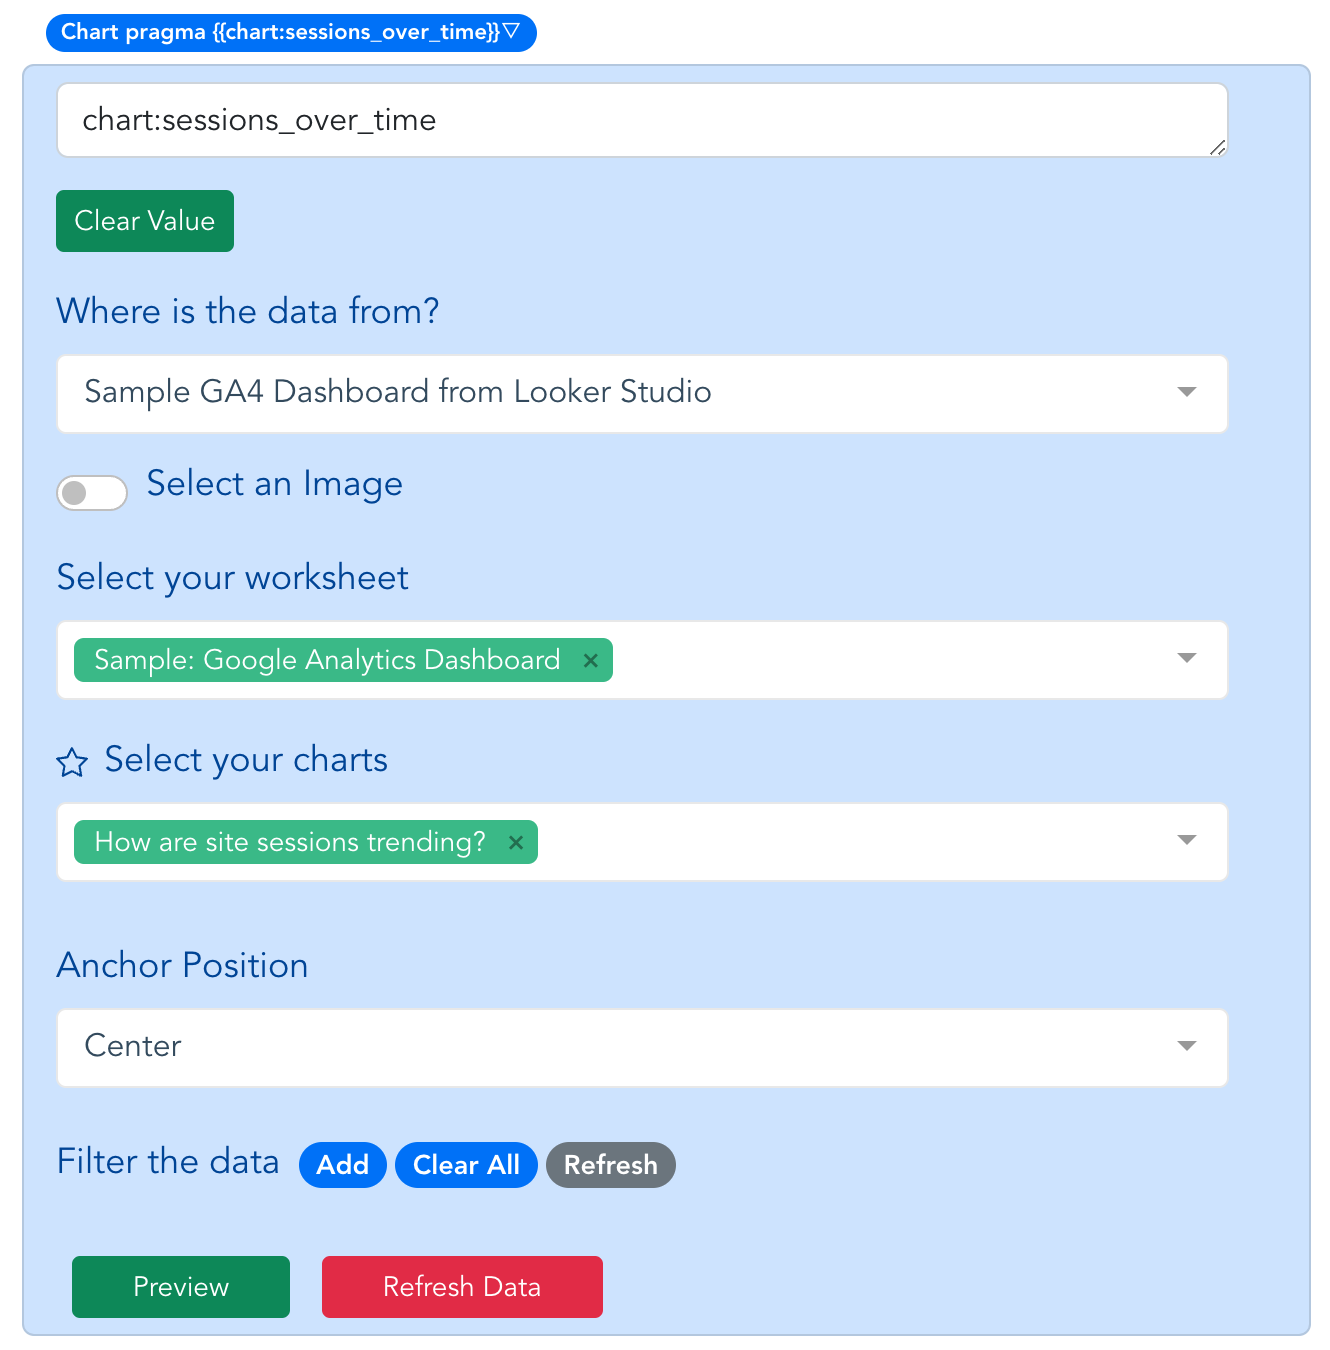
Each placeholder from the template is shown in a blue box. Let's look at {{chart:sessions_over_time}}. Set the data source, then choose the chart, and set the anchor position.
To pull in a number, such as a KPI or metric, it is a similar process. Slideform captures the data behind each table and chart and you can filter and perform simple functions to select the data you want to use. For example, I can pull out the number of Views and embed it into the report in a text box.
Embed AI-generated Content: Embed content created by the AI Assistant into any placeholder by selecting it in the configuration options. It will update automatically as the data change.
Data Filtering: With Slideform, you control the filters dynamically, without having to go to the dashboard. You can filter the data with any filters that are included in your dashboard, such as date range, client, or campaign. You can filter the data for each chart separately, or you can set an overall filter for the project. Slideform supports custom date ranges, plus several built-in date ranges. In the example, I set the project-level date filter to "Prior Week".
Step 5: Generate and save the output slide deck
Generate a Google Slide deck from your Looker Studio dashboard by clicking Generate on the project card. If you did not preset the values for all placeholders, you will be prompted to fill them in now.
Save the deck to any Google Drive location, or convert it to PPT and save to OneDrive. The output will appear on your Projects page when it's done. You can also Set a Schedule for Recurring Presentations to auto-generate and email the slides to you. Or you can create a batch of presentations, one for each client, with Slideform Bulk Mode. Awesome, right!
Check out my report! The styling, colors, fonts, and layout are preserved and the charts and metrics are filled in from the dashboard!
Sample Output
Slideform is the most powerful solution to connect Looker Studio to Slides
- No screenshots! And no copying & pasting
- Set filters and date ranges
- Create new visuals and insights from your data
- Generate reports on a schedule
- Insert metrics and text from the dashboard
- Combine Looker Studio with other data sources
- Use a custom slide template in the format of your choice