Import Power BI elements into slides: A step-by-step guide
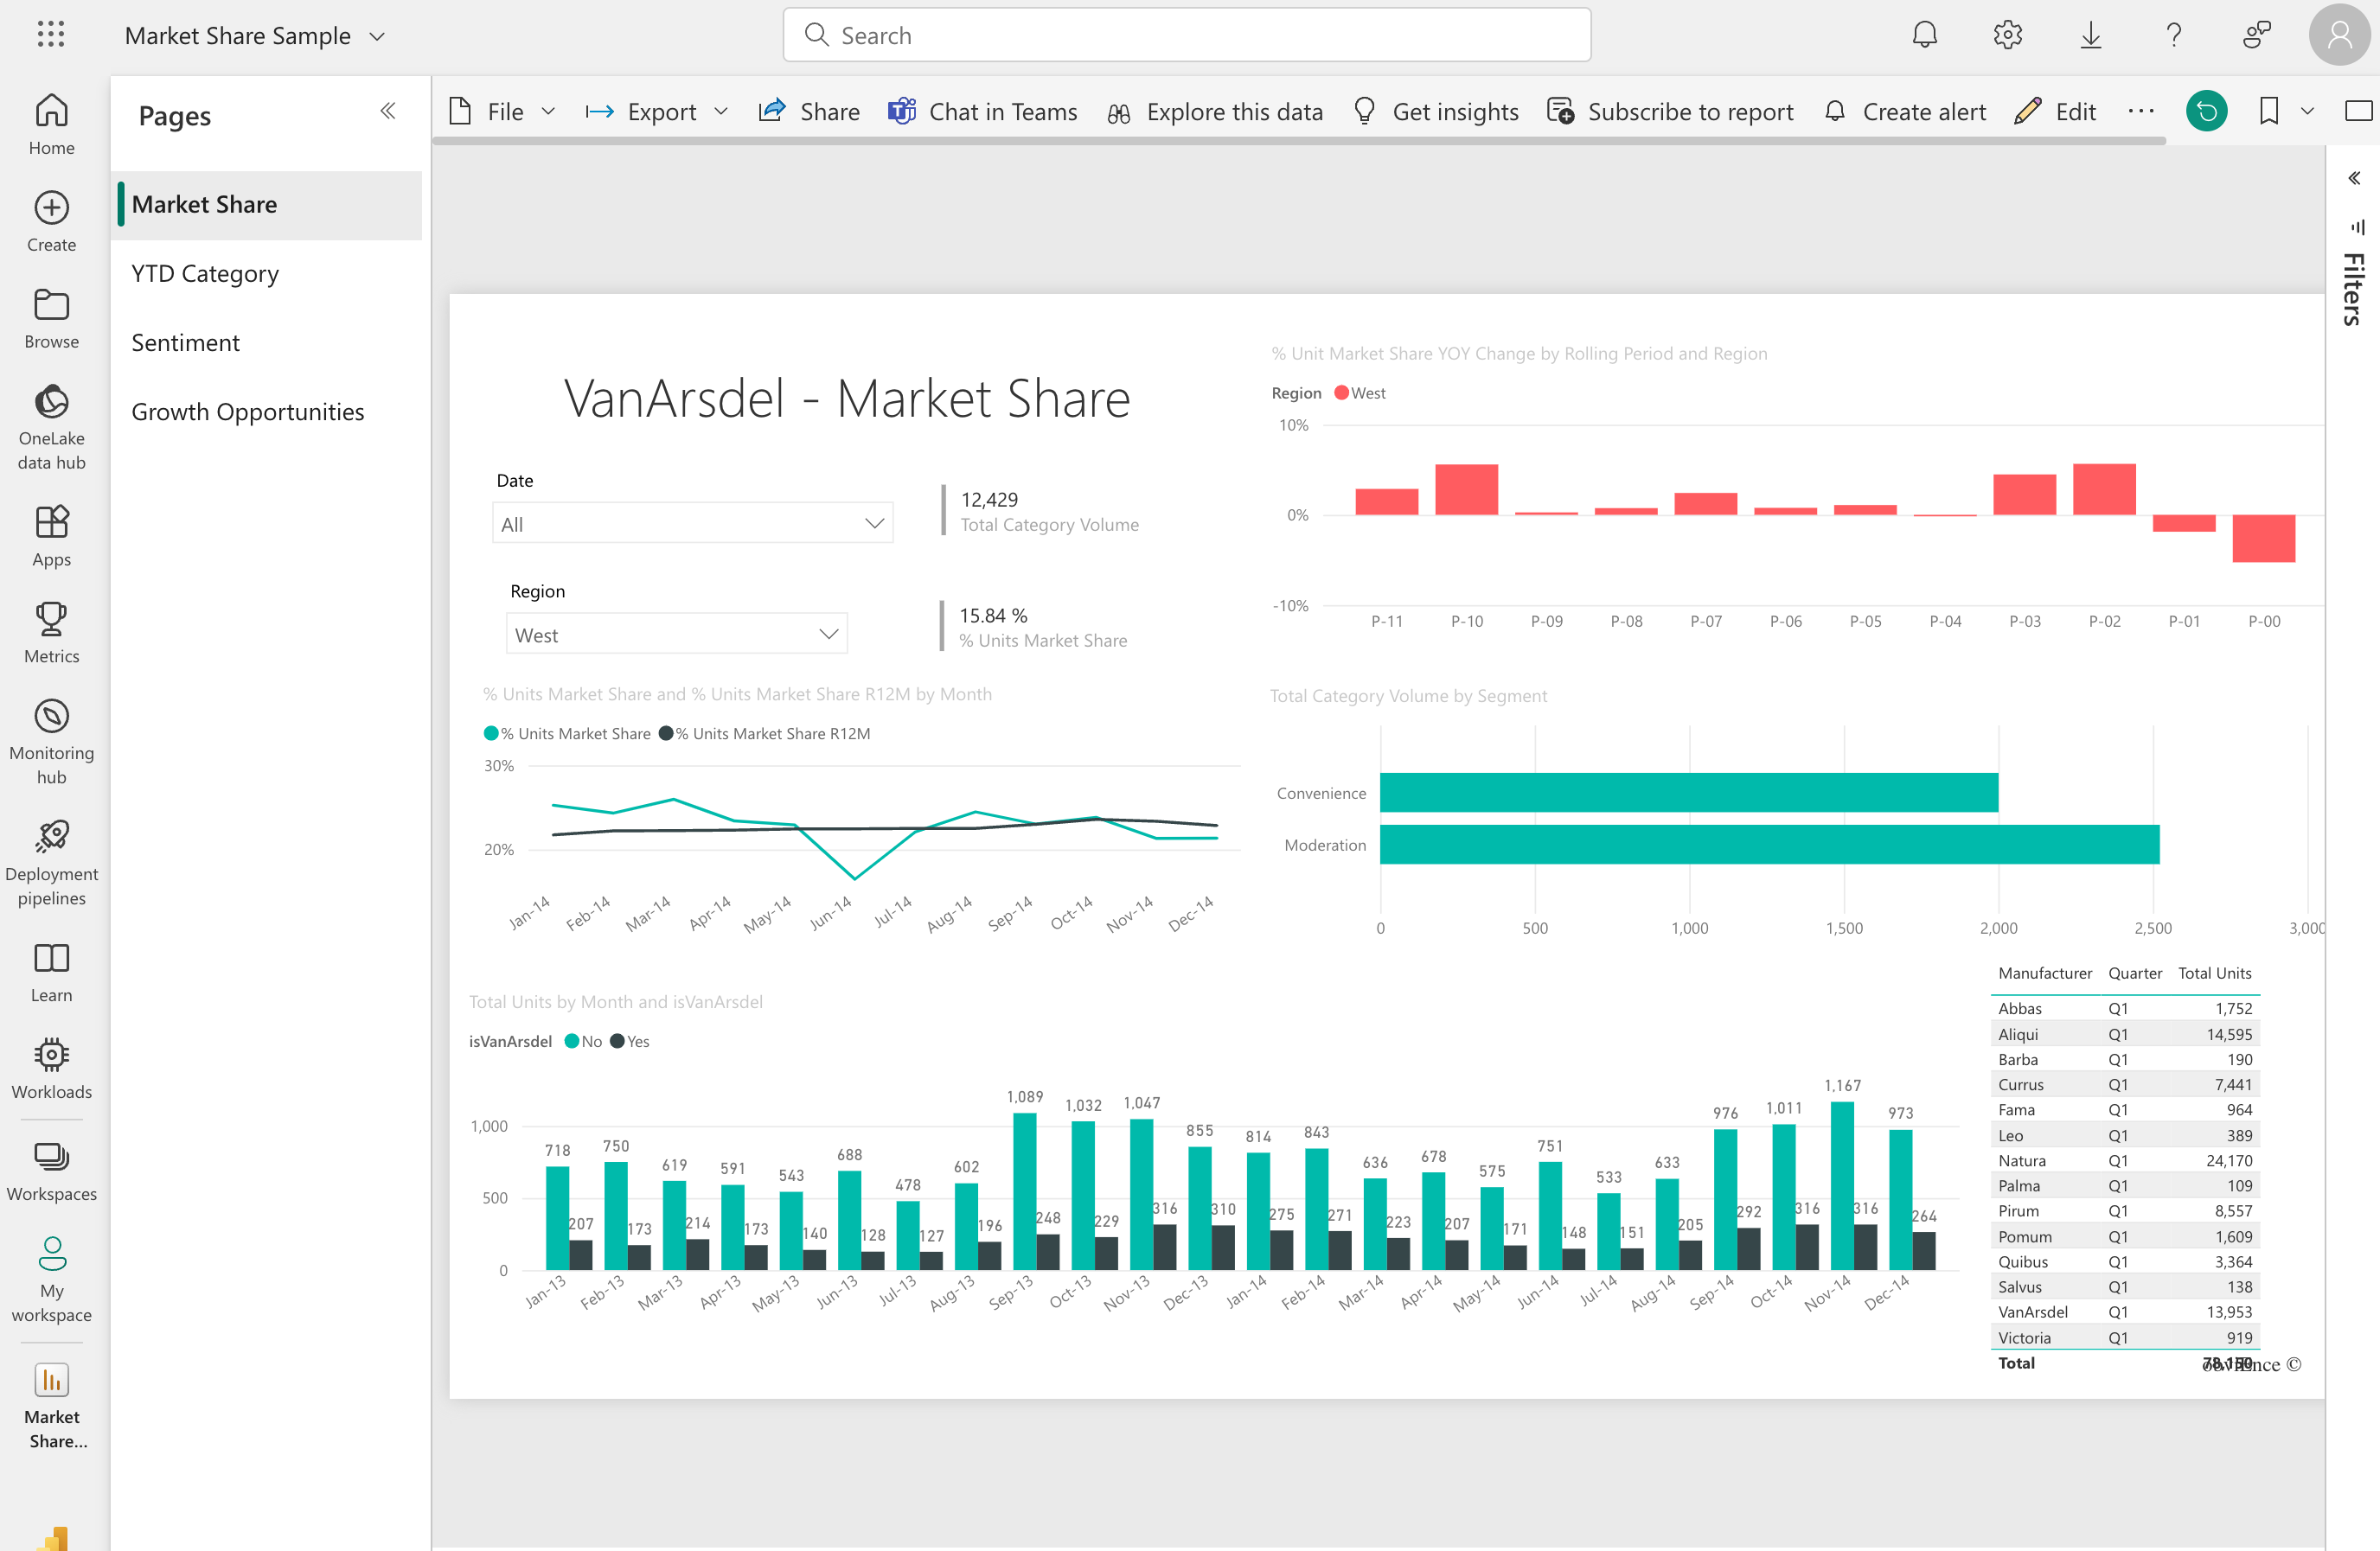
Step 1: Connect Power BI to Slideform
Provide Slideform access to the dashboard, then, log into Slideform and go to Data Sources > Add Data Source and Add Integration. Copy the URL of the dashboard into Slideform. Its super simple to set up, and you'll always have the latest data available for your reports! For more details on setup, see How to Connect A Data Source.
Step 2: Create a slide deck template
Next, you need a template for your presentation. With Slideform, you can use your own custom-branded slides in the format of your choice, PowerPoint or Google Slides. Just start with a previous version of your report slides and insert placeholders (enclosed in curly braces) for any elements that will change between versions of the report, like text, numbers, tables, images, charts, logos, and names. All the colors, styling, fonts, and sizing of the elements in the template will be carried through to the slide deck output.
Here is one slide from my report template with placeholders for data, tables, and charts that will come from Power BI.
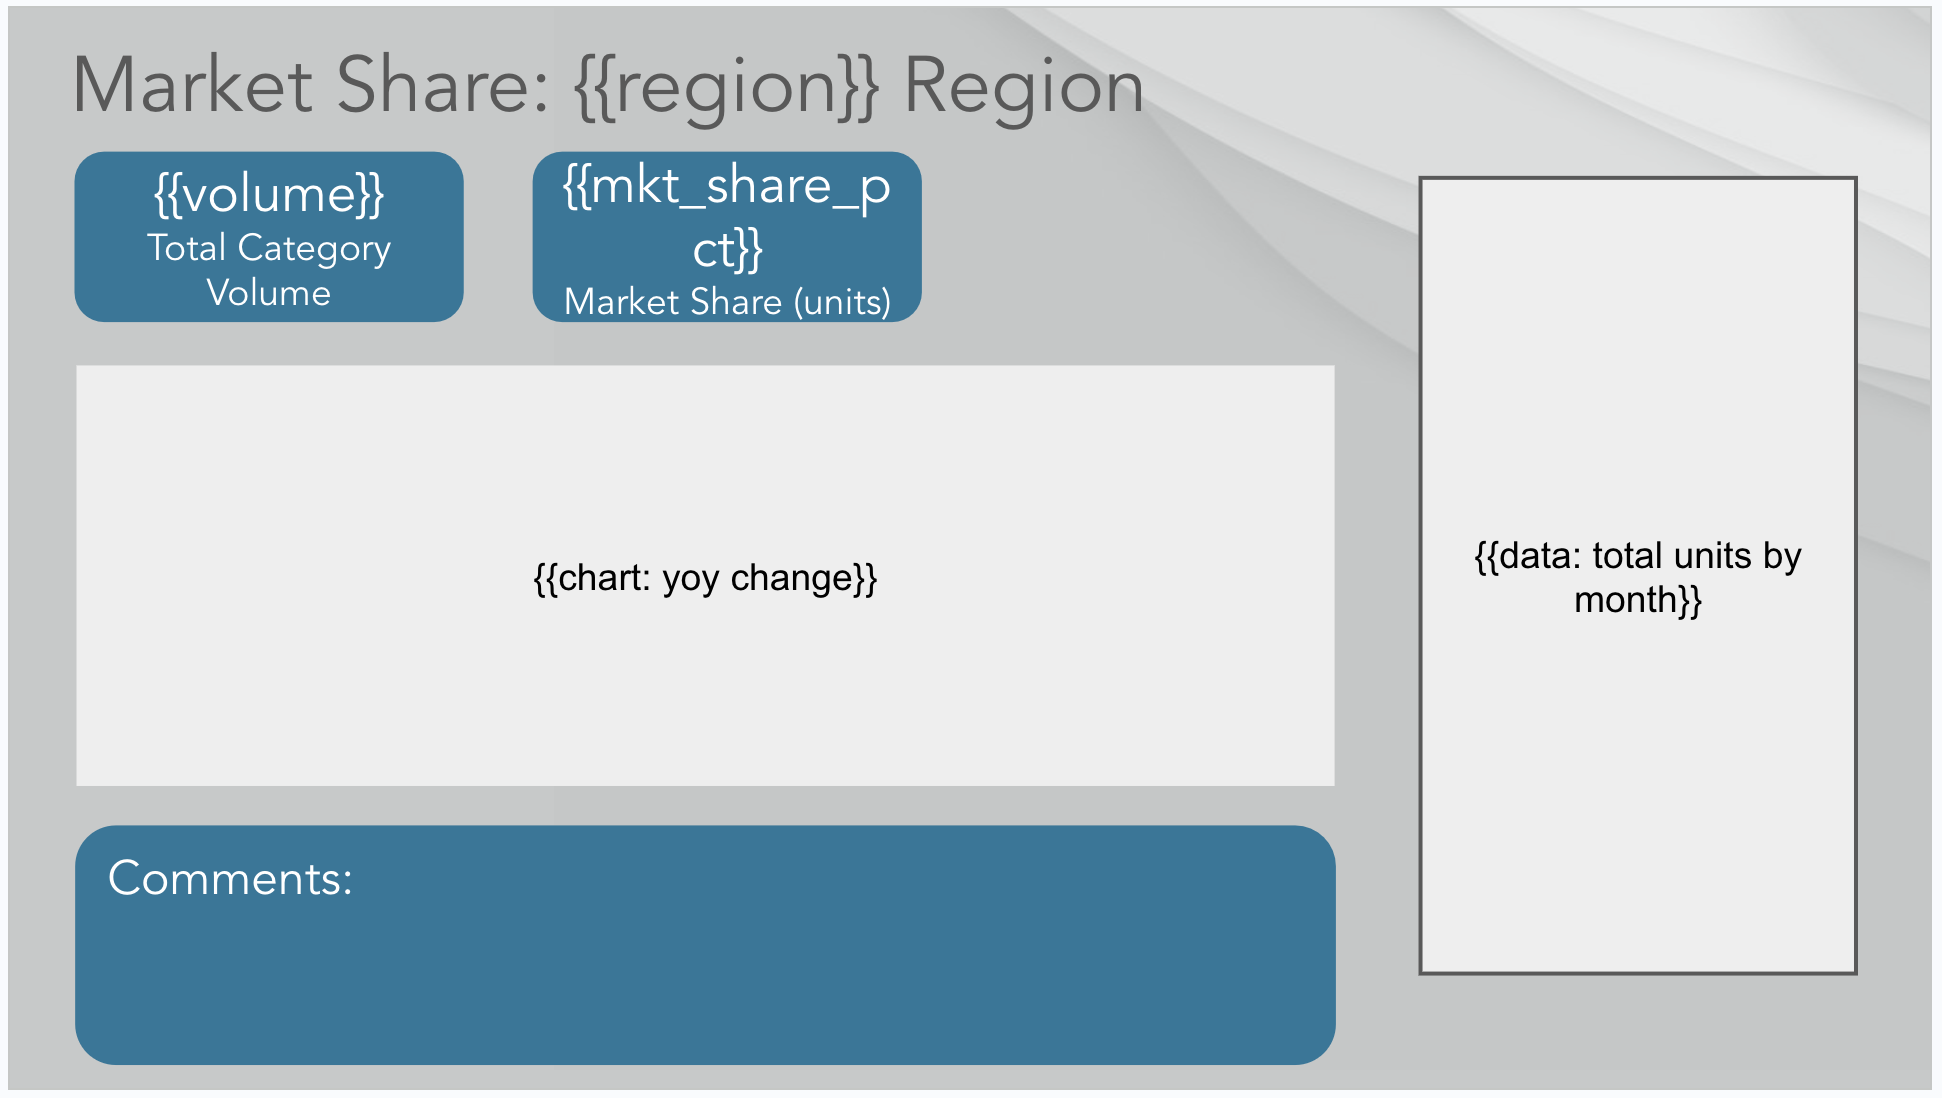
Just upload your slide template to Slideform as a New Project. Give your project a name and associate the Power BI data source.
Step 3: Match each placeholder to the Power BI content
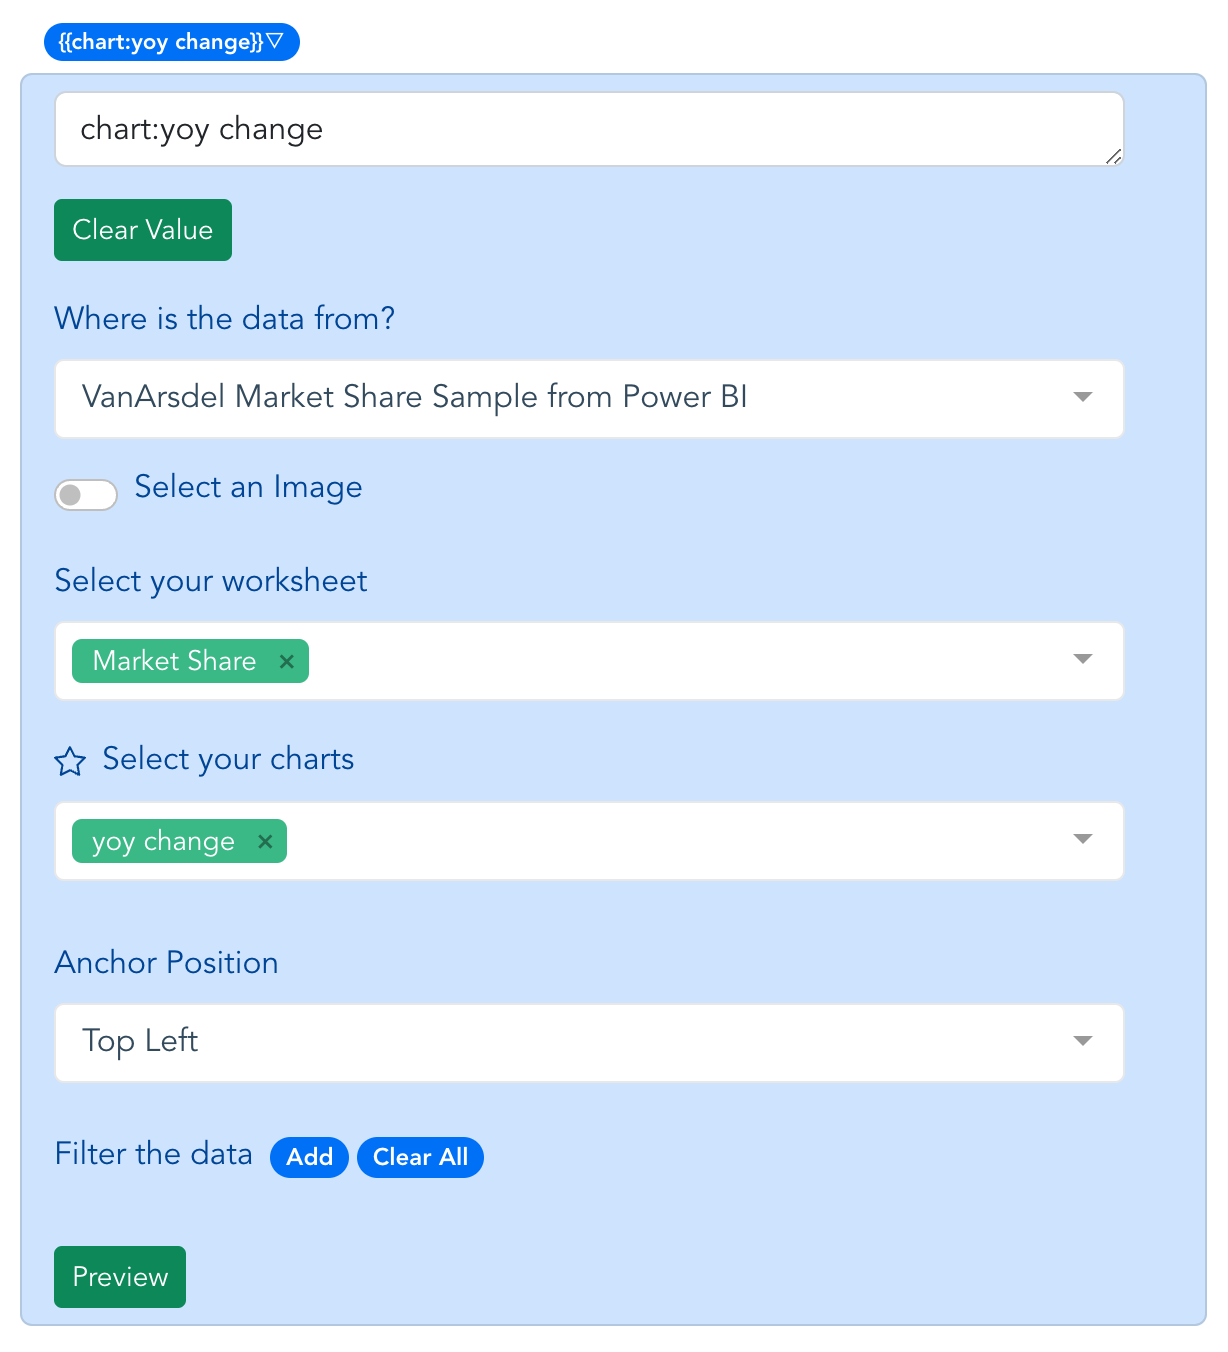
Now, we need to match each placeholder in the slide template to the correct chart or other content that will fill it. Open the project for editing by clicking Configure Data on the project card. Just select the data source, then choose the chart or table, and set the anchor position. For example, see how I selected the chart for the {{yoy change}} placeholder. You can filter the data with any filters that are included in your dashboard, such as date range, category, or region.
To pull in a number, such as a KPI or metric, it is a similar process. We pull in the data behind each table and chart and you can filter and perform simple functions to select the data you want to use.
Step 4: Generate and save the output slide deck
Generate a Google Slide or PowerPoint deck from your Power BI dashboard by clicking Generate on the project card.
Next you will see a preview of your output. Or if you don't want to wait, just save the presentation directly. You can also Set a Schedule for Recurring Presentations to auto-generate and email the slides to you. Awesome, right!
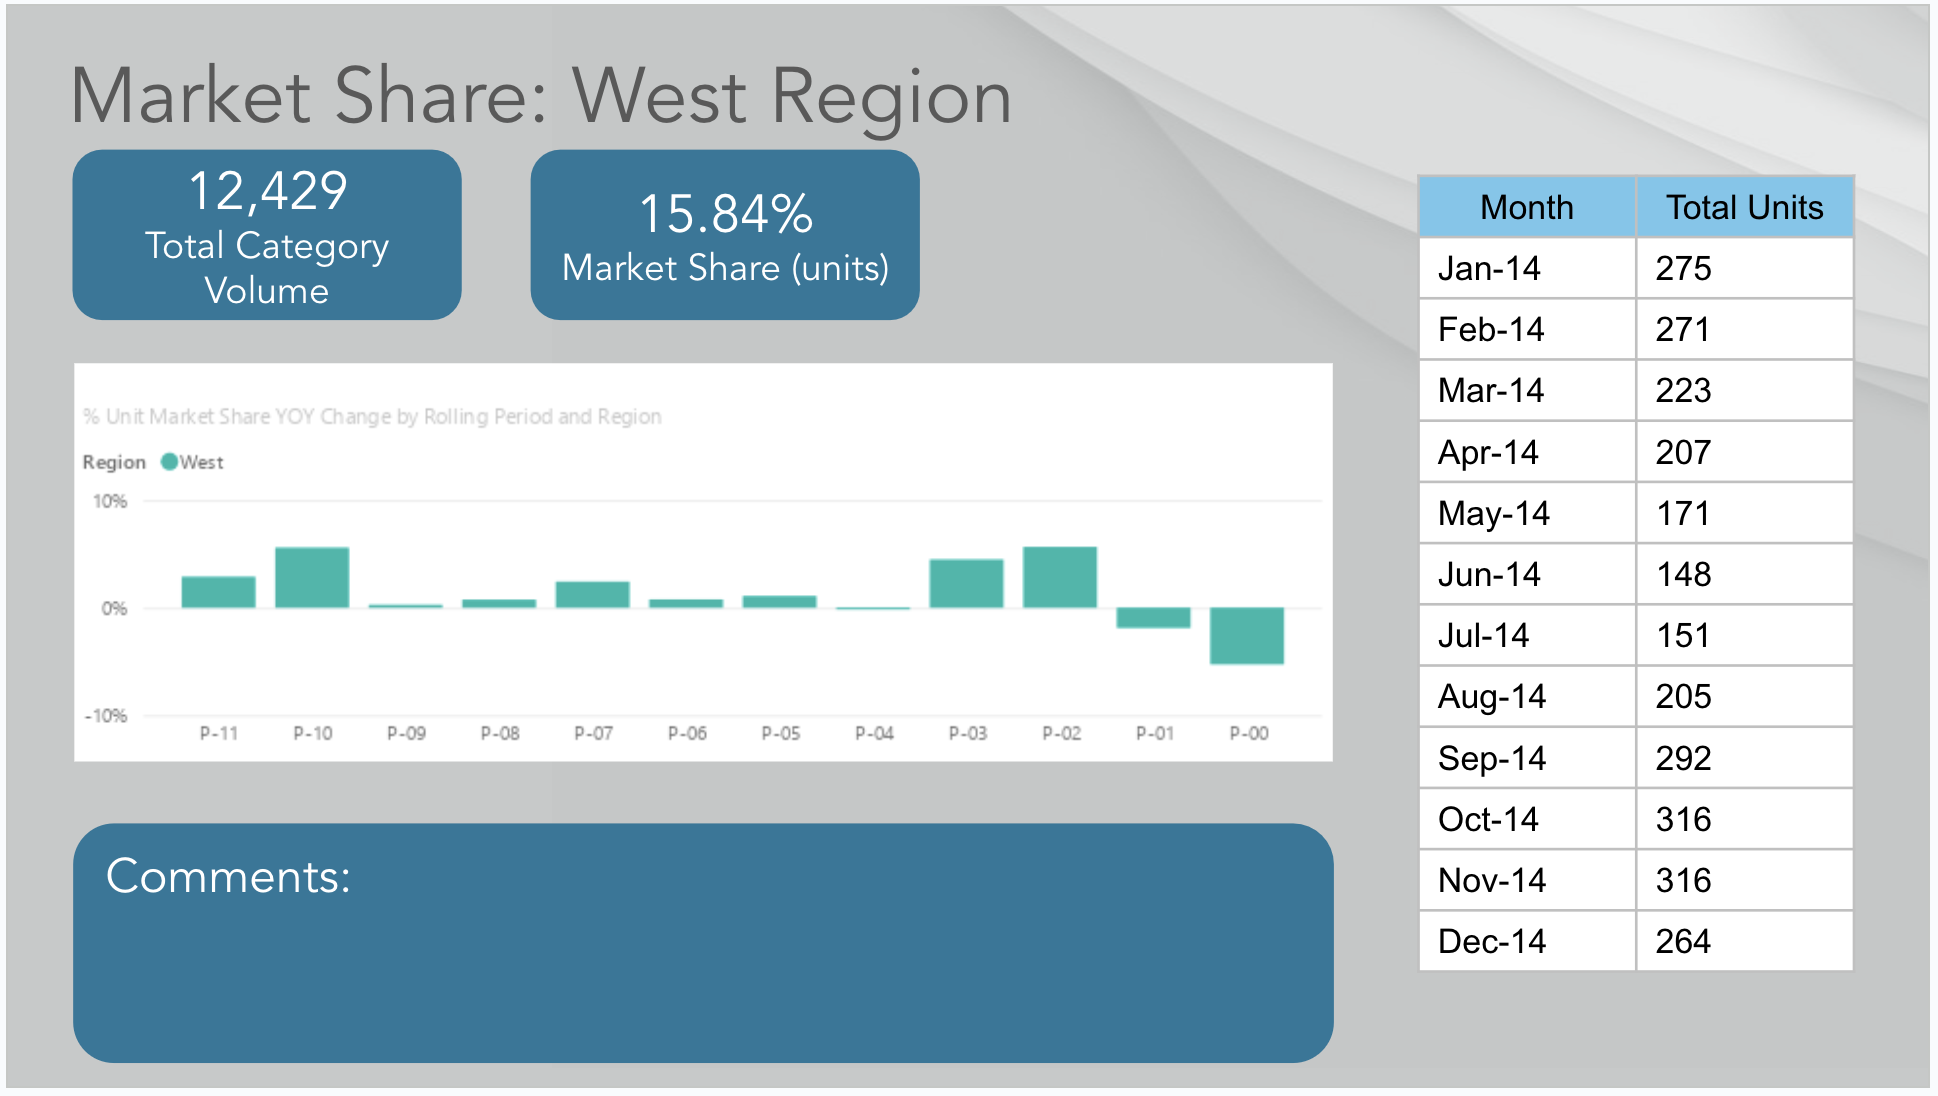
Check out my report slide. The styling, colors, fonts, and layout are preserved and the charts and metrics are filled in from the dashboard!
Benefits of Slide Automation
Do your execs and clients want their report in a slide deck? With Slideform automation, your team can use your internal Power BI dashboard and also send out reports in the format the recipients prefer.
Advantages of Slideform automation:
- No screenshots! And no copying & pasting.
- Set recurring presentations to auto-generate on a schedule.
- Slides are viewable by all recipients; no Power BI access required.
- Data (charts, graphs, numbers) automatically update when you generate a presentation.
- Combine Power BI with other data sources and content including spreadsheets, images, and text.
- Use your own custom slide template in the format of your choice.
- Output slides in Google Slides, PowerPoint, or PDF format
Start your free trial today!