
This guide walks through the core Slideform setup process step by step so you can build your first automated presentation.
The basic flow is simple:
- Link a data source.
- Load a slide template.
- Match data to the template.
- Generate the presentation.
GOAL: Launch your first Slideform project with a reusable template, connected data, and a clean output you can use again later.
What is Slideform?
Slideform is the AI Analyst for business analytics and reporting. It helps teams turn dashboards, spreadsheets, CRMs, and warehouses into polished presentations, documents, spreadsheets, emails, and dashboards.
What to Prepare Before You Start
You do not need everything perfect before opening Slideform, but a little preparation will make setup much faster.
- A previous report or presentation in Google Slides or PowerPoint that you want to reuse, or a clear idea for a new presentation you want to build from scratch
- A data source such as Google Sheets, Excel, Salesforce, HubSpot, or a BI dashboard
The Basic Setup Flow
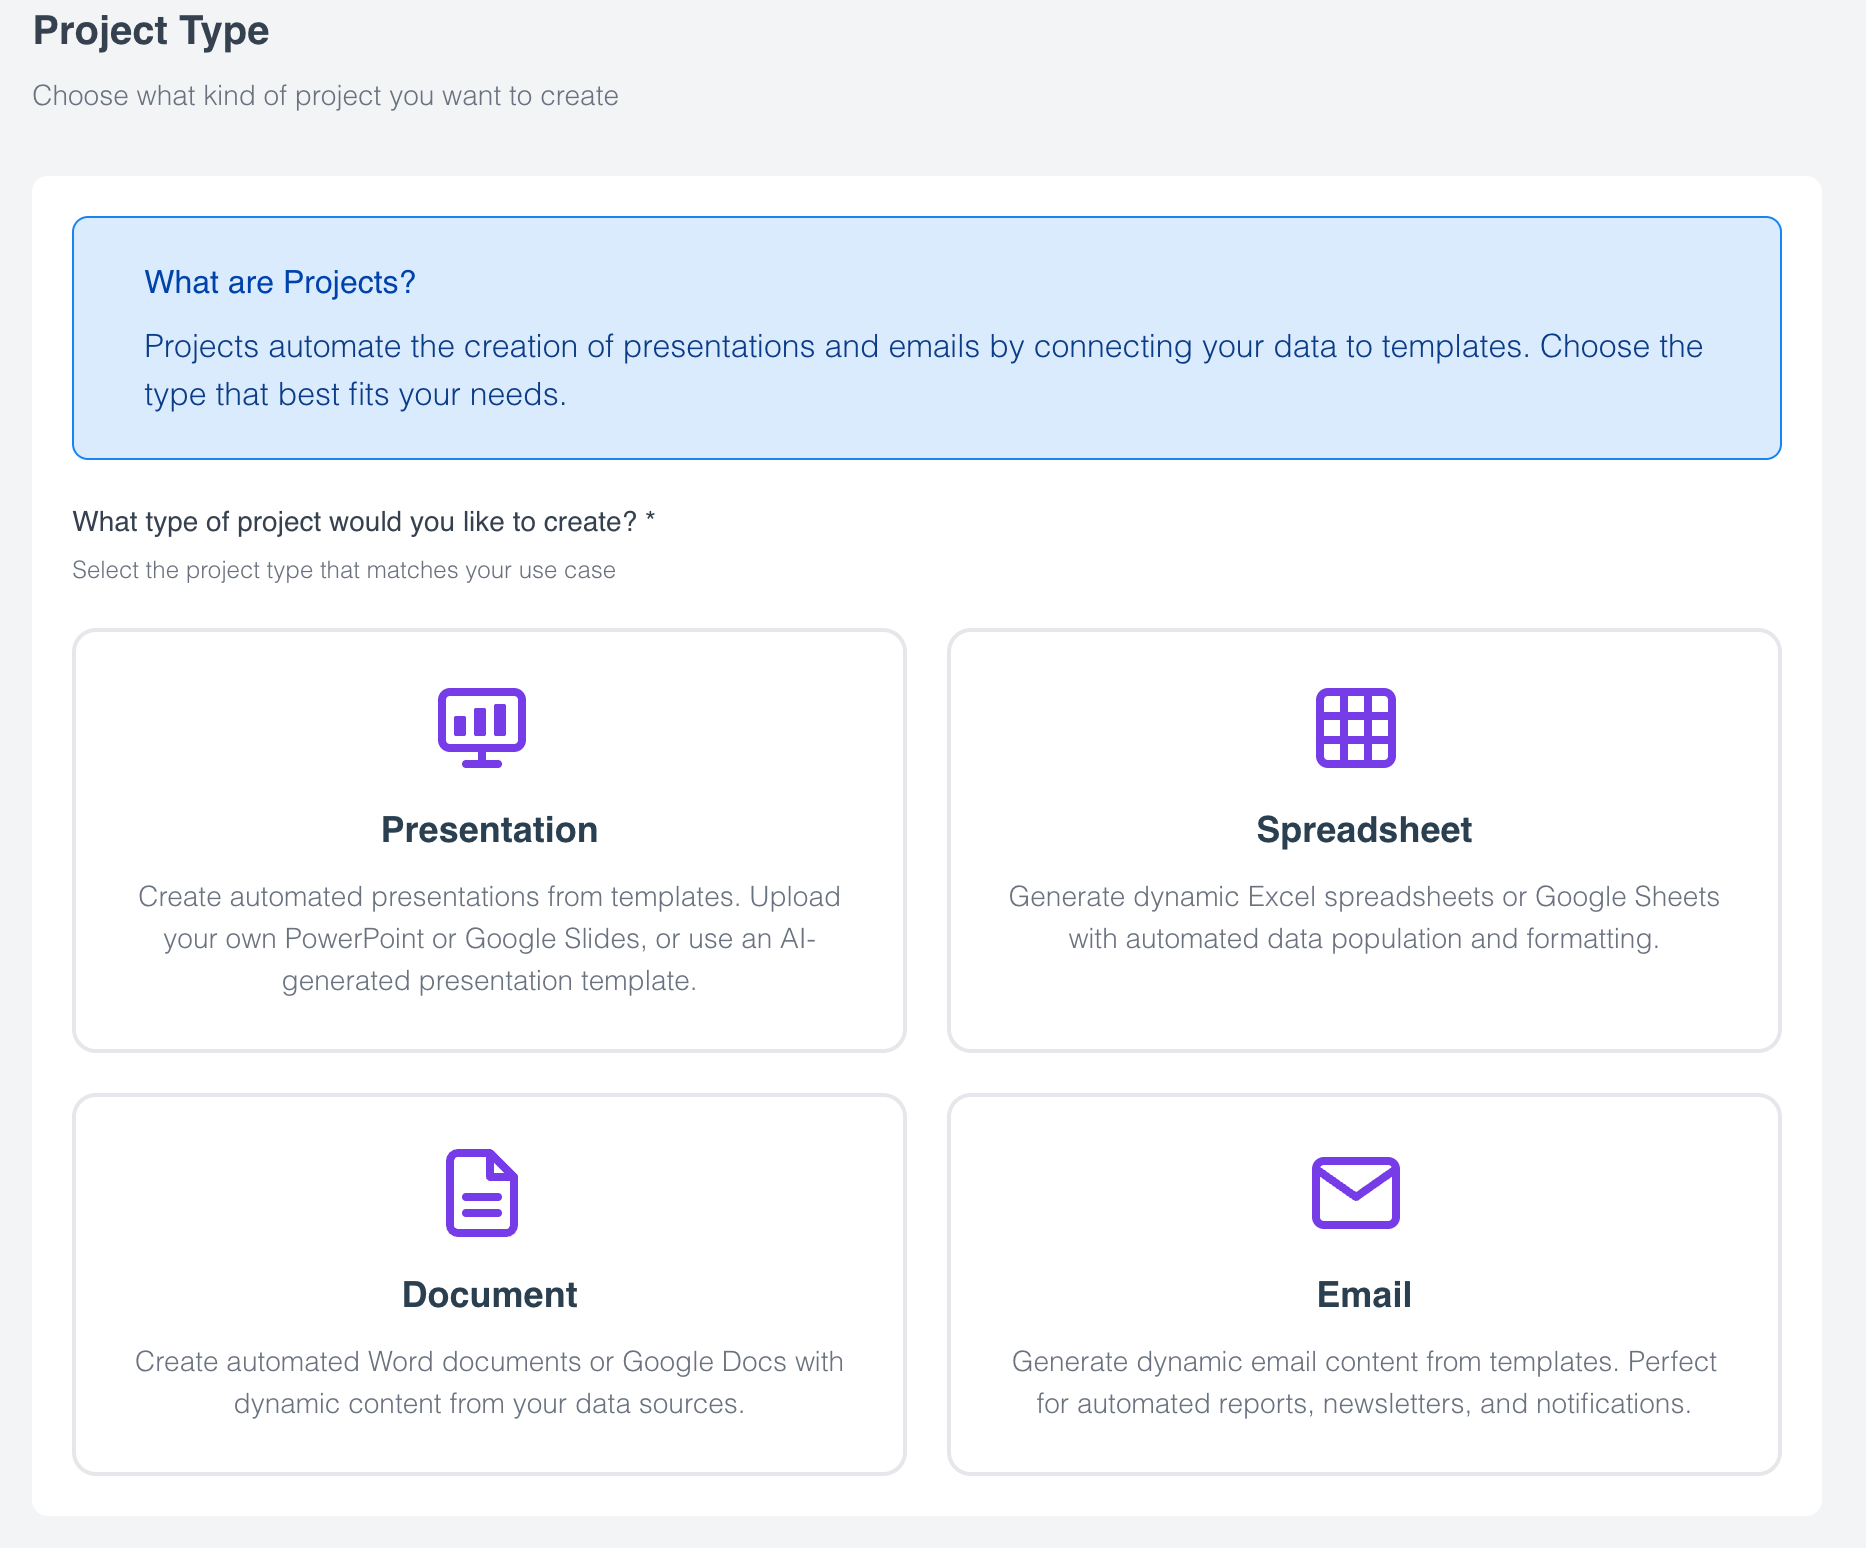
1. Start a new project
Use the new project wizard to create a presentation project. This is where you choose the workflow you want to set up and move into template and data configuration.
2. Choose or create a template
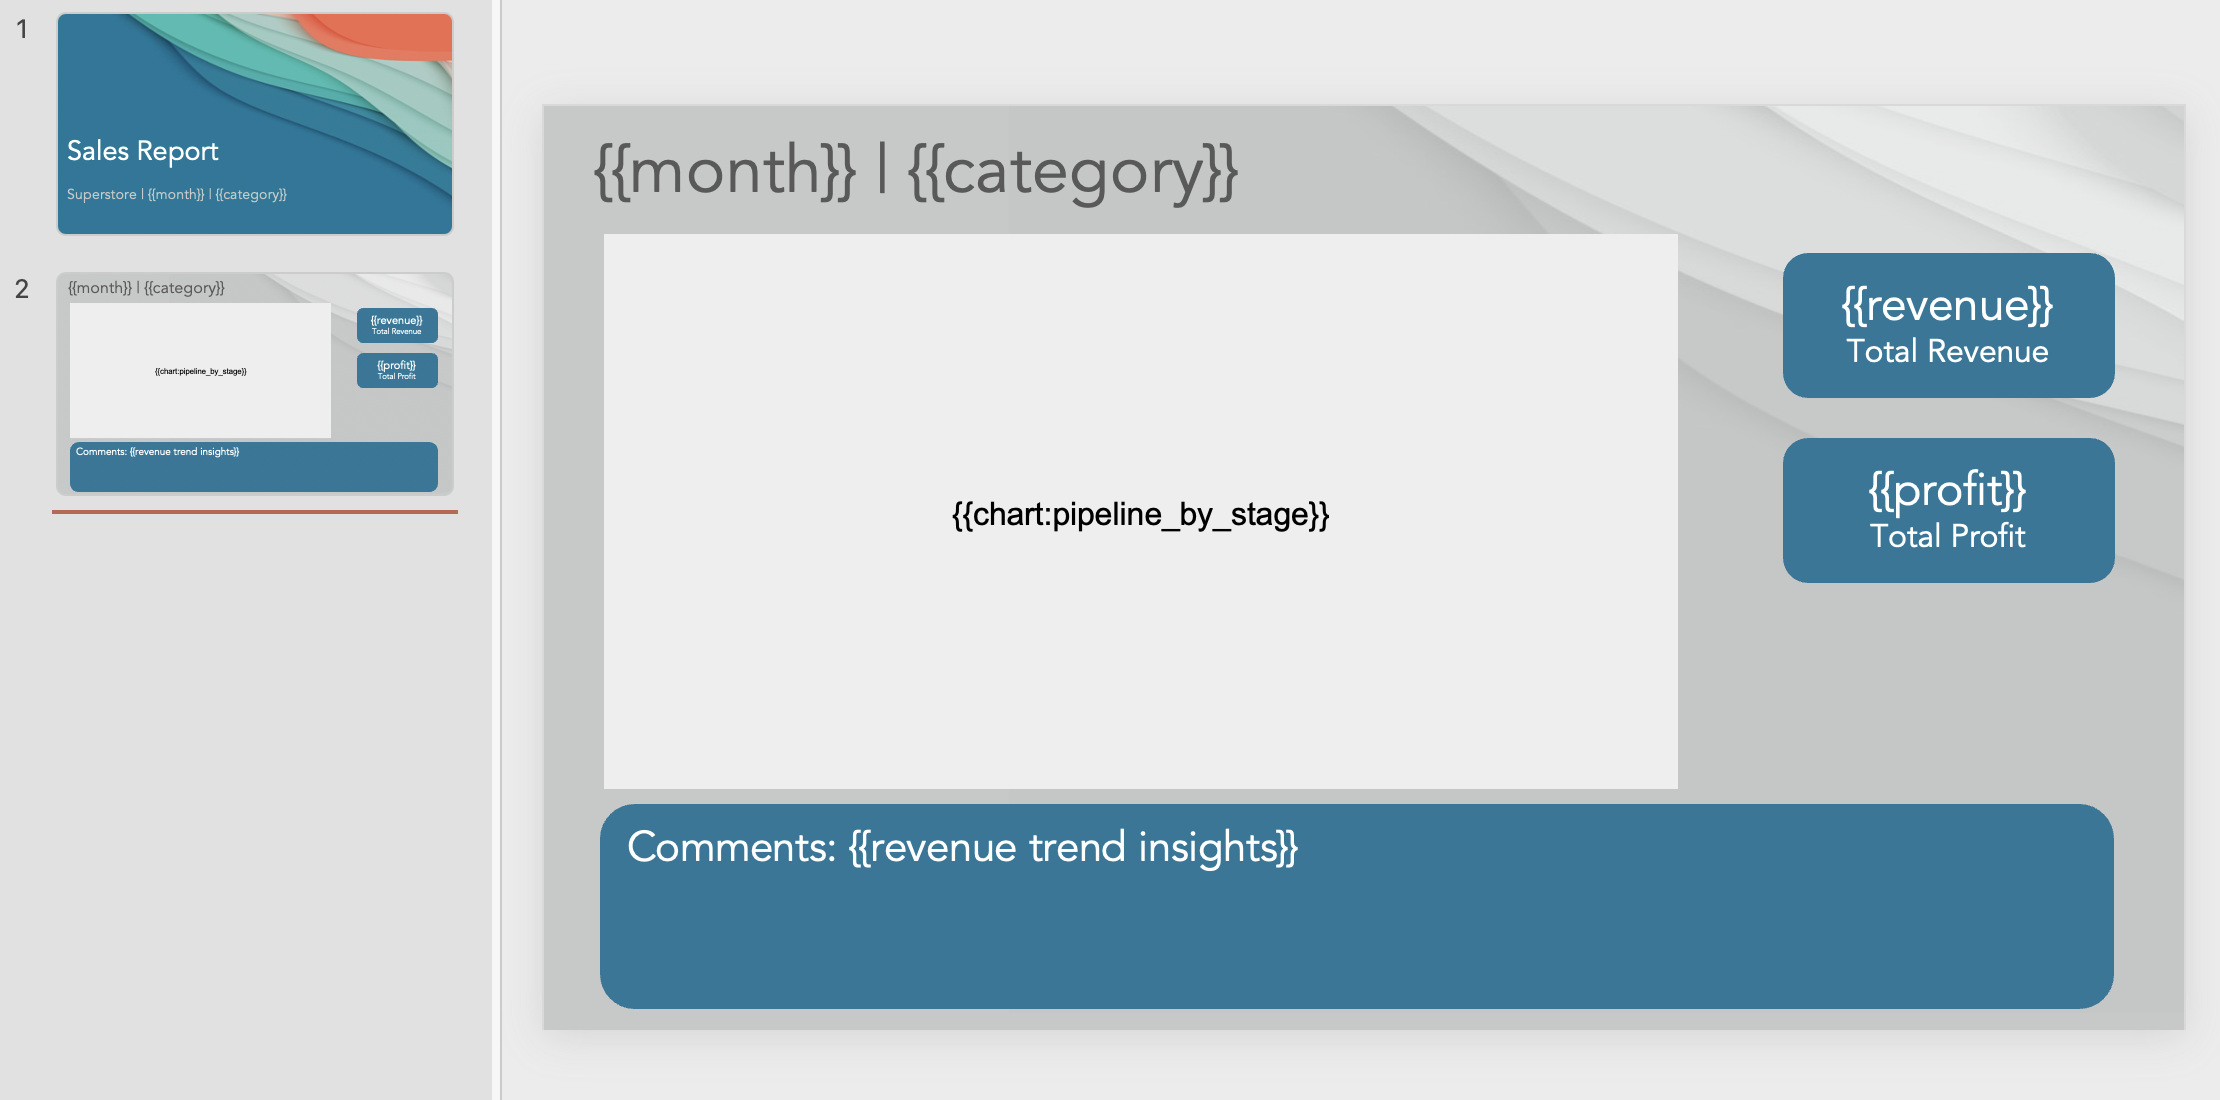
Decide if you want to replicate an existing presentation or create something entirely new. If you already have a recurring report, upload that deck and turn it into the starting template. If not, create a new presentation structure first and then add placeholders where Slideform should insert dynamic content.
The template is the part of the workflow that stays stable. It defines the layout, styling, and content slots that future reports will fill.
Those dynamic placeholders often look like this:
Once these placeholders are mapped, Slideform can generate new versions of the report without rebuilding the design from scratch.
3. Link the data source
Link the dashboard, spreadsheet, CRM, or warehouse that contains the live numbers and charts you need. To connect a data source, go to Data Sources and click New, then follow the setup instructions. For the first project, keep things narrow and start with one report and one data source before you try to automate everything at once.
That keeps the first mapping pass simple and makes it easier to validate the output.
4. Match Data to the Template
Tell Slideform where each KPI, chart, table, or text summary belongs inside the template.
How to map your data:
- Click on the placeholder field.
- Select your data source, such as Google Sheets or Salesforce.
- Choose the specific data element, such as a chart, table, or value.
- Configure any additional options, such as filters or formatting.
Pro tip: Use the AI Analyst
The AI Analyst can help generate charts, metrics, tables, and summaries that fit the structure of your report. This is useful when you need more than a raw dashboard screenshot and want cleaner, more reusable reporting assets.
- Create a chart from live business data
- Write an executive summary from the latest numbers
- Build a table for a recurring client or team update
- Save outputs so they can be reused across future runs
5. Generate the Presentation
Once the mappings look right, generate the presentation and review the output. At this point you are mainly checking that the right data landed in the right places and that the deck still looks clean.
Video Walkthrough
If you want a quick visual explanation of template setup and first-project flow, this walkthrough is a good companion to the written steps above.
Frequently Asked Questions
Do I need a finished template before I start?
No. You can start from an existing deck or create a new template with AI, then refine it as you map real content into it.
What should my first Slideform project be?
Choose one recurring report with a clear audience and a limited number of KPIs or charts. That usually gives the fastest path to a clean first success.
Can I automate more than presentations?
Yes. Slideform can also generate spreadsheets, documents, emails, and dashboard-style outputs depending on the workflow you set up.
When should I use schedules or bulk mode?
After your first single run looks correct. Once the mappings and layout are stable, schedules and bulk generation become much safer to use.
Related Guides
- Create a Presentation Template with AI for Recurring Reports
- Slideform AI Analyst for Presentations, Charts, and Insights
- Automate QBRs with Slideform
- Generate PowerPoint from Excel with AI
Build the First Version, Then Improve It
The fastest way to get value from Slideform is to ship one working workflow instead of trying to automate everything in the first session.
Once your template, data connection, and mappings are in place, the rest of the system gets much easier to scale.
See what Slideform can do for you
Start with one automated report, then expand the workflow once the first version is working cleanly.