Need to turn Excel data into a polished PowerPoint presentation fast? Instead of manually building charts, rewriting takeaways, and formatting slides one by one, you can use AI to analyze the spreadsheet and generate a presentation with clear insights, strong visuals, and the style of your own branded template.
In this post, we'll show how to go from Excel to PowerPoint with AI using Slideform. Start with a spreadsheet, use AI to identify the most important findings, and generate a presentation that follows the branding and styling of an example deck.
GOAL: Create a PowerPoint presentation from a spreadsheet with charts, insights, and recommendations while keeping the look and feel of your preferred presentation style.
What is Slideform?
Slideform is the AI Assistant for Analytics. Upload an example presentation, connect data, and use Slideform's AI to generate charts, analysis, and written insights in a branded format. The video below uses Google Sheets and Slides, but the process is exactly the same with Excel & PowerPoint.
The best way to go from Excel to PowerPoint
This is where Slideform comes in. Instead of manually translating spreadsheet data into slides, Slideform helps you turn a Excel file into a research-driven presentation. You connect the Excel file, upload an example presentation for visual direction, and ask the AI to analyze the data and build the story.That means one workflow can handle:
- Reviewing the spreadsheet data
- Identifying patterns and outliers
- Creating charts and tables
- Writing slide headlines and summaries
- Generating strategic recommendations
- Producing a presentation that matches your preferred brand and style
Unlike most chat-based tools, Slideform can also automate recurring presentations, where you repeat the same deck for different clients, time ranges, or categories. Check out our guide to Creating Recurring Presentations from Excel with AI.
How to create a presentation from Excel with AI
Step 1: Connect your Excel sheet
Start with the spreadsheet you want to analyze. This could be:- Financial transactions
- Survey responses
- Sales pipeline exports
- Marketing campaign results
- Customer support logs
- Product usage data
Once the sheet is connected, Slideform can inspect the columns, review the data, and use AI to answer questions about what is happening in the spreadsheet.
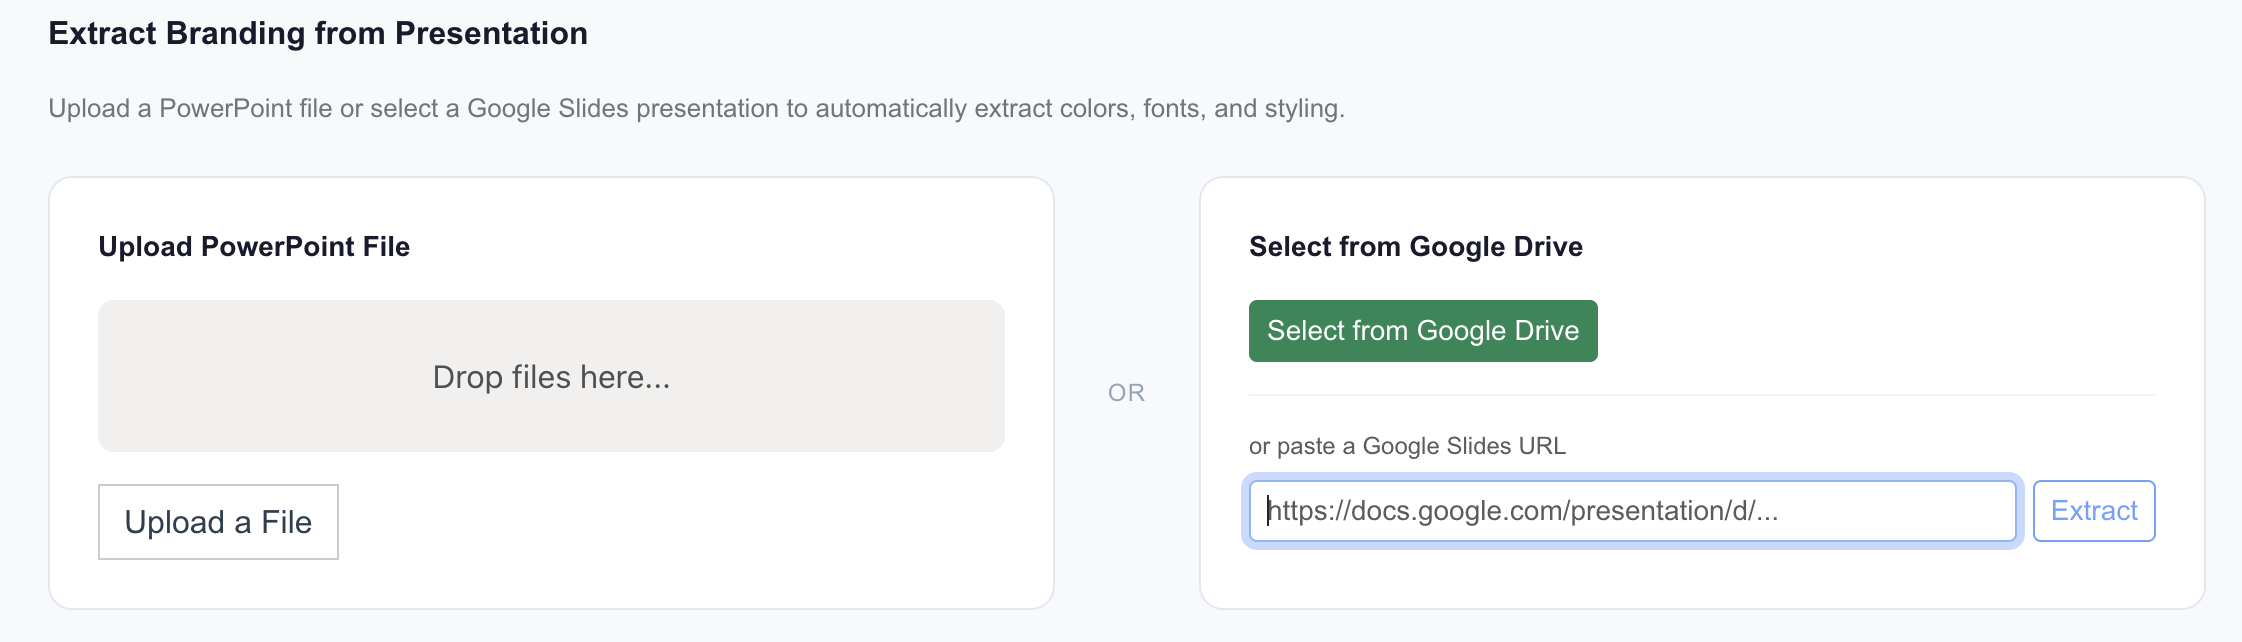
Step 2: Upload an example presentation to establish the visual style
If you already have a deck with the branding, typography, layout, and overall look you want, upload it into Slideform. Instead of generating generic slides, Slideform can use that example presentation as the design reference for the new output.
Step 3: Ask Slideform to analyze the spreadsheet and build the story
This is where the magic happens.
You can prompt Slideform's AI to analyze the spreadsheet, decide what matters, and build a narrative for the presentation. That means you're creating a research report and then turning that report into slides.
Here is an example:
Slideform can generate summary analysis and individual charts as well as full presentations. Find examples in How to make Charts from Excel with Slideform AI.
Step 4: Generate the PowerPoint presentation
Once the analysis is complete, Slideform can generate the final presentation. The output is not just a dump of charts. It is a structured presentation with a point of view: what happened, why it matters, and what someone should do next.
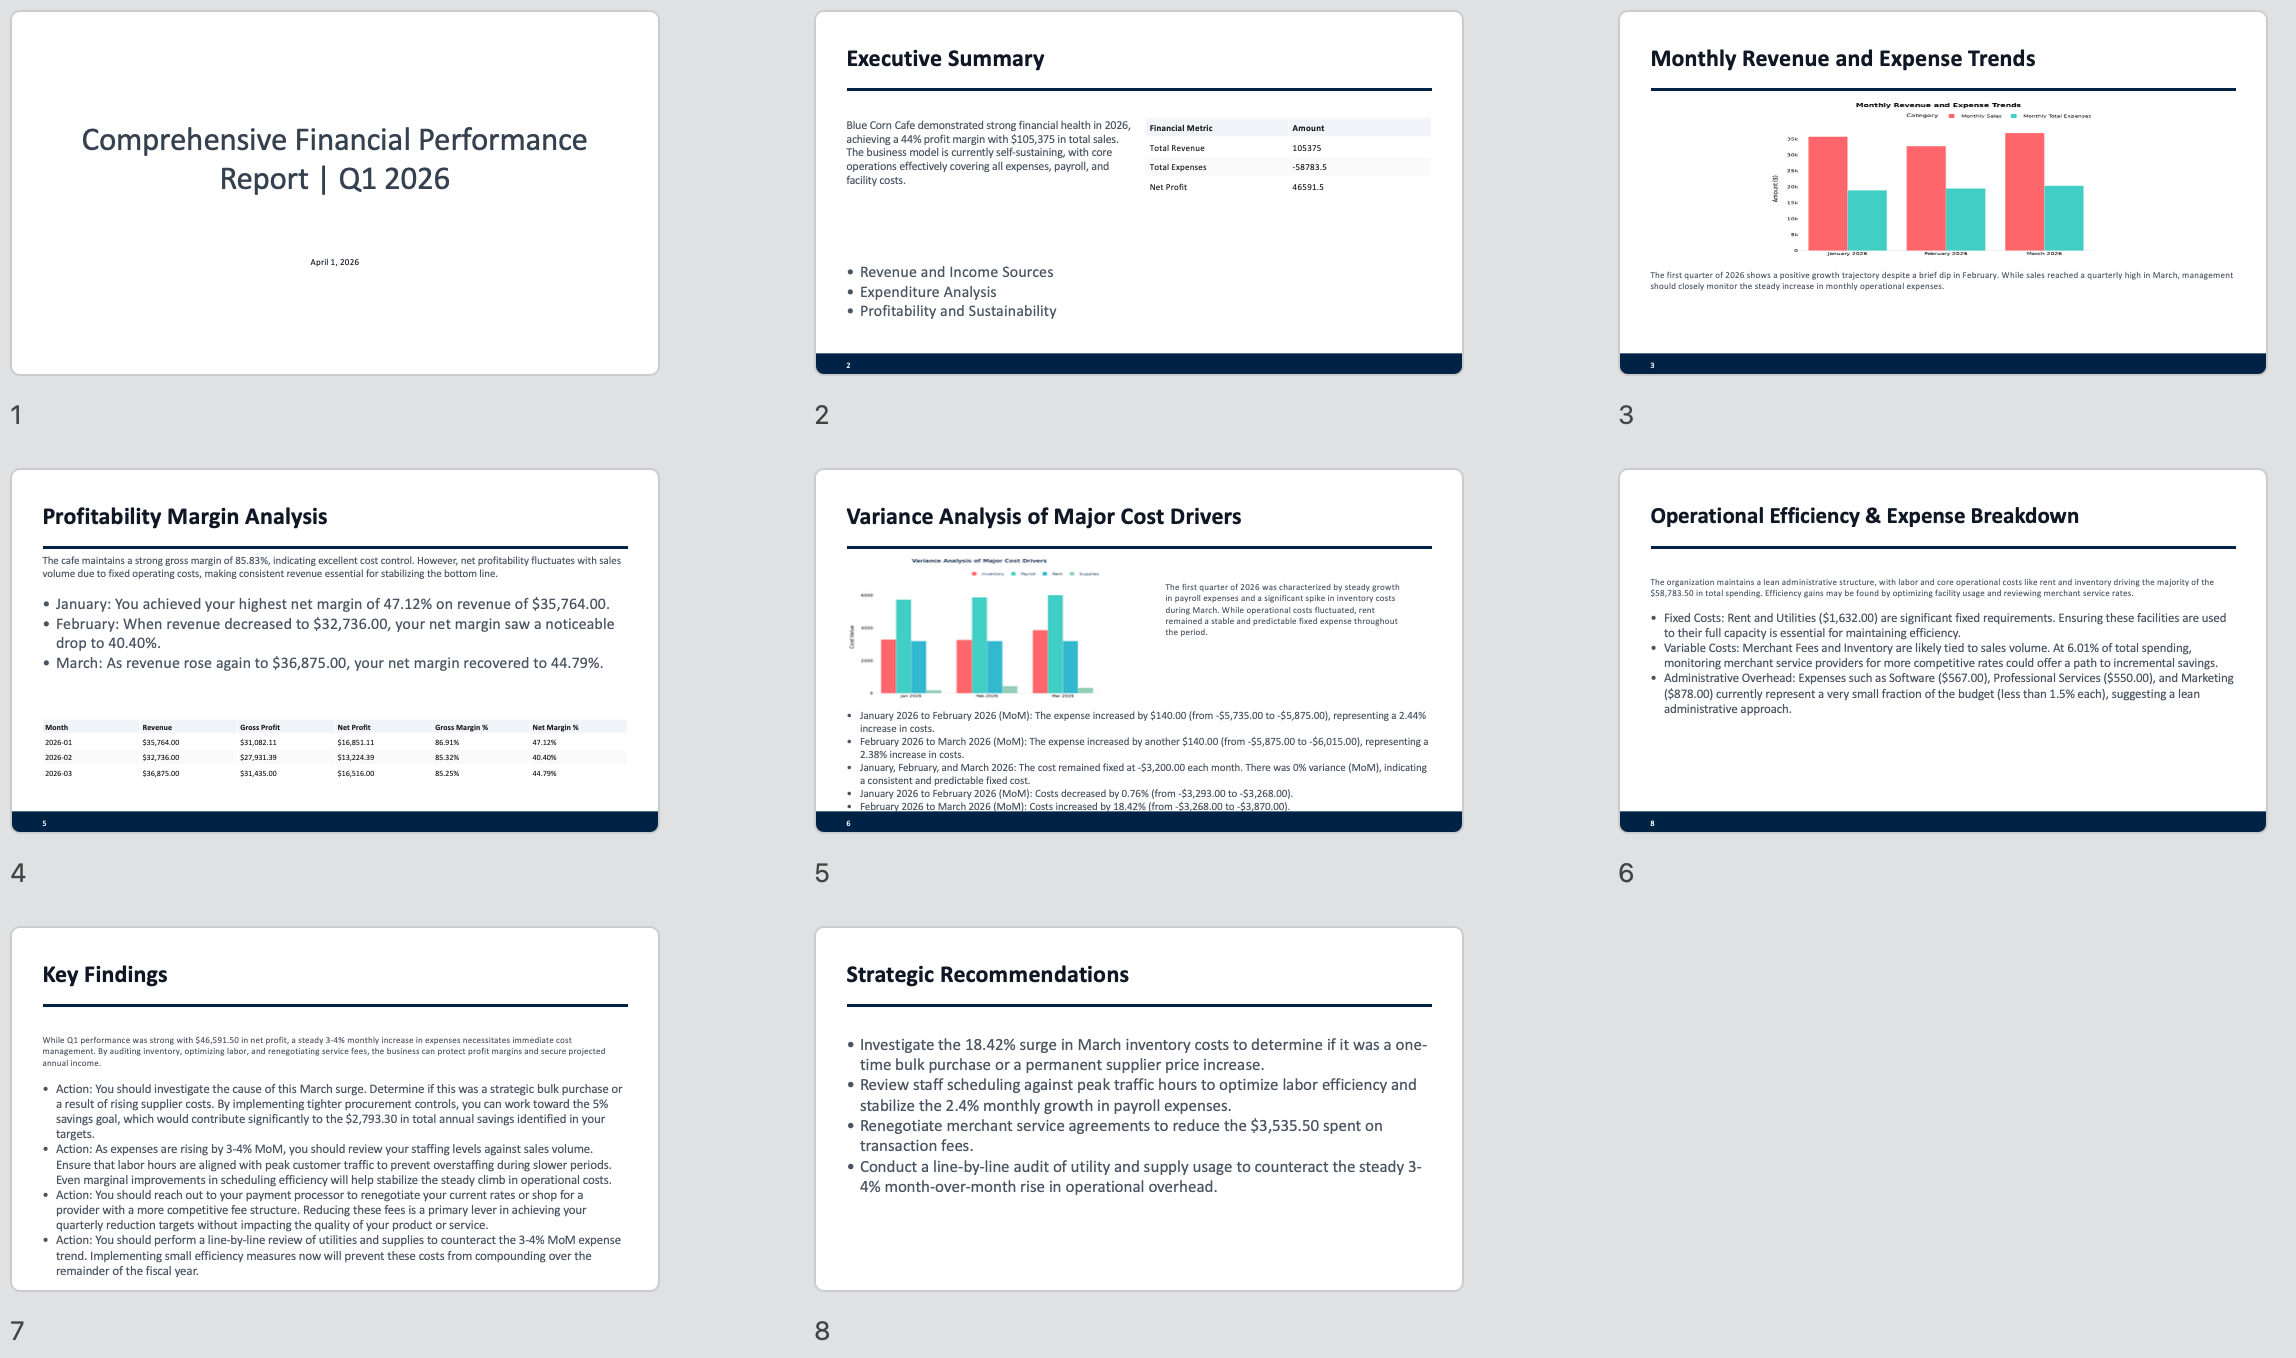
One example of this workflow is taking a spreadsheet of raw financial transactions like sales revenue, expenses, and operating costs, then turning it into a presentation about monthly P&L and business performance.
In that case, Slideform can:
-
Analyze the raw transaction data
-
Summarize top line revenue and profit trends
-
Identify the biggest cost drivers
-
Highlight changes month over month
-
Recommend ways to improve profitability
Here's the final presentation for the Blue Corn Cafe financial performance data. I wouldn't say it is quite client-ready, but it's about 75% there and I an make any formatting and content changes directly in the slides. In addition, I can easily apply a different presentation theme by asking the AI to recreate the deck with a different theme.
Example use cases
Finance is just one example. The same approach also works for market research, sales analysis, operations reviews, and customer reporting.
Market research presentations
Turn survey data, response tables, and segmented findings into a clear presentation with themes, charts, and recommendations.
Sales and revenue analysis
Use exports from your CRM or spreadsheets of deal activity to create a presentation about pipeline trends, win rates, segment performance, or rep productivity.
Operations reviews
Analyze fulfillment, staffing, support, or process data and generate a presentation that explains bottlenecks, changes, and improvement opportunities.
Customer or product research
Take spreadsheet exports of user behavior, feature adoption, churn signals, or support issues and build a presentation around what teams should do next.
Getting started
If you want to create a PowerPoint presentation from a Excel file, here's the quick version:
1. Connect your Excel file in Slideform.
2. Upload an example presentation to create the custom presentation theme.
3. Ask Slideform to analyze the spreadsheet and identify the key findings.
4. Create the final PowerPoint presentation based on that analysis.
That's it. Your spreadsheet becomes the source material for a presentation instead of a manual copy-and-paste project.