This guide explains how to automatically export data from Power BI easily and efficiently. Power BI...
Embed Looker Studio Metrics in Slides as Text
Looker Studio, formerly Google Data Studio, is a low-cost, easy-to-use business analytics solution. Their pre-made templates make it super simple to create an interactive dashboard from hundreds of data sources. But getting charts and metrics into reports, documents and presentations can still be a manual process. There are several tools to pull screenshots of your dashboard into a report, but these tools only embed images of the dashboard. To insert dashboard content as text or an editable table, you need Slideform!
Slideform's integration with Looker Studio allows you to pull all your Looker Studio content directly into presentations. Use your own customized template and generate reports in PowerPoint, Google Slides, and a variety of other formats. Slideform's advanced capabilities far surpass any of the automated screenshot tools on the market. And today, we'll dive into our newest feature: the ability to embed data from charts, tables, or scorecards into a text box on your slides.
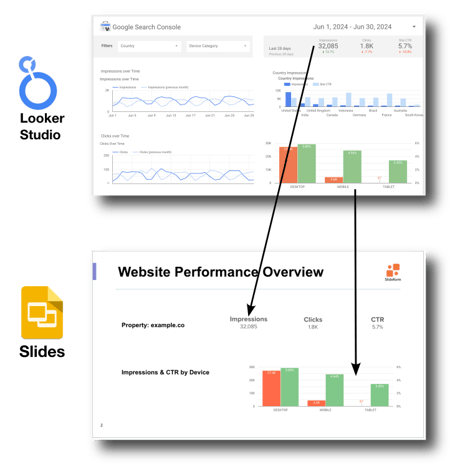
 In this example, we pulled data from a scorecard object on the Looker Studio dashboard and inserted the number into a text box in the slides. The text is fully editable in the Google Slides output. We also embedded a cleanly-cropped image of a chart from the dashboard into the slides.
Slideform puts your presentations on auto-pilot! Slideform makes it easy to embed any content from your dashboard into slides dynamically, and auto-generate the presentation on a recurring schedule.
How to integrate Looker Studio with Google Slides or PowerPoint
Step 1: Connect Looker Studio to Slideform
Start by connecting your Looker Studio dashboard to Slideform. Log into Slideform, navigate to Data Sources > Add Data Source, and select Looker Studio. Share your Looker Studio dashboard with share@slideform.co and enable embedding then copy the dashboard URL into Slideform.
Step 2: Create a Slide Deck Template
Design your presentation template in PowerPoint or Google Slides, including placeholders for dynamic elements like text, numbers, images, and charts. Upload your template to Slideform by going to New Project, naming your project, and linking it to the Looker Studio data source. Read more about How to Create A Template.
My dashboard has scorecards that display metrics like the number of website impressions, clicks, and click-through rate. I want to include these metrics in a report as editable text, not as pictures of the scorecard. To do this, I created a slide template, with text boxes for the metrics from my dashboard. The placeholders are just text surrounded by curly braces. The font, color, and size of the placeholder text will be used for the final output. I also used a chart placeholder inside a rectangle shape object, which will be filled in by a chart from my dashboard.

Step 3: Match Placeholders to Looker Studio Content
In Slideform, open your project and match each placeholder in your template to the corresponding data from Looker Studio. For example, link the number of impressions to the {{impressions}} placeholder by selecting the correct dashboard element and the "value" from that element.
Then go to the chart placeholder and select the relevant chart that will fill it. You can filter and customize data for each placeholder, including applying date ranges or filters.
Step 4: Generate and Save the Output Slide Deck
Generate the slide deck by clicking Generate on your project card. Fill in any remaining placeholders and preview the final output. Save the presentation to Google Slides or Powerpoint format and set up a schedule for recurring reports if needed. The final output will maintain your template’s styling, colors, fonts, and layout, filled with the latest data from Looker Studio.
Why use Slideform?
- No screenshots! And no manual copying & pasting.
- Set recurring presentations to auto-generate on a schedule!
- Data (charts, graphs, numbers) automatically update when you generate a presentation.
- Combine Looker Studio with other data sources and content including spreadsheets, images, and text.
- Use your own custom slide template in the format of your choice.
Want to see what Slideform can do for you?
Get full access to Slideform with a 30-day free trial. No credit card required.


