Power BI is a leading BI tool from Microsoft that allows teams to create dynamic, interactive dashboards. However, teams that receive Power BI dashboards often need access to the underlying data. And end users may prefer to work with the data in Google's office suite, which can pose some difficulties.
To get Power BI data into Google Sheets for analysis, business users usually need to manually export a CSV file and copy and paste everything into Sheets. The entire process is time-consuming, laborious, and error-prone. It’s also nearly unworkable when dealing with thousands of rows and columns of data.
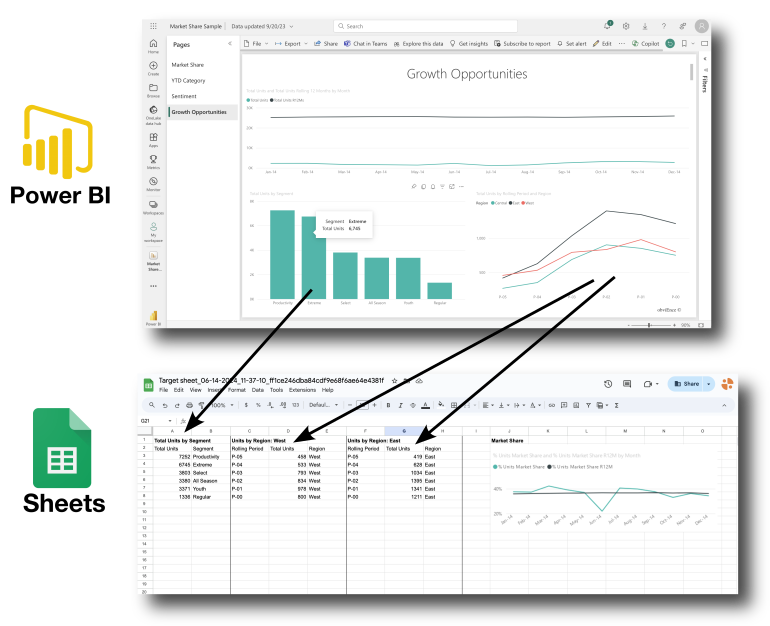
But that doesn’t have to be the case. The following guide will demonstrate the best way to automate recurring Power BI data exports, to get Power BI data and charts into spreadsheets.
Why Extract Data from Power BI?
Client-facing teams need to use data that is locked up in Power BI. Oftentimes, Power BI data is already transformed by the data or analytics team, and offers access to KPIs that are blended from multiple systems. Client-facing teams can make use of this robust, enriched data in reports and custom analysis.
However, most client-facing teams do not have the experience or permissions needed to work directly in Power BI. Furthermore, the Power BI dashboards and reports do not offer easy access to the underlying data.
In order to harness the underlying data, client-facing teams often extract the data in a CSV file format. But this process is highly manual and requires users to copy-and-paste the data directly into Sheets. In addition, the CSV export includes all data behind a chart, and the user often needs to further filter and refine this data. This process slows down sales and reporting efforts and leads to data errors. Finally, the CSV export is an unformatted data table that must be formatted with borders, colors, and headers before sharing with others.
Client-facing teams need a way to automate Power BI data exports into spreadsheet platforms such as Google Sheets. Read on to learn how client-facing teams achieve this with Slideform.
How to automatically pull Power BI data into a spreadsheet
- Connect Power BI to Slideform
- Create a template spreadsheet to receive the data
- Match data to placeholders in the sheet
- Schedule the automation
1. Connect Power BI to Slideform
Slideform captures your entire dashboard and all elements (charts, KPIs, data tables, & filters) for use in reports, slides, and spreadsheets.

To get started, in Slideform, go to Data Sources and click Add Data Source. Click Add Integration under Power BI.
On the next page you will be prompted to authenticate with your Microsoft credentials. Then select the workspace (Group) and report (Dashboard) that you want to connect.
2. Create a customized spreadsheet template
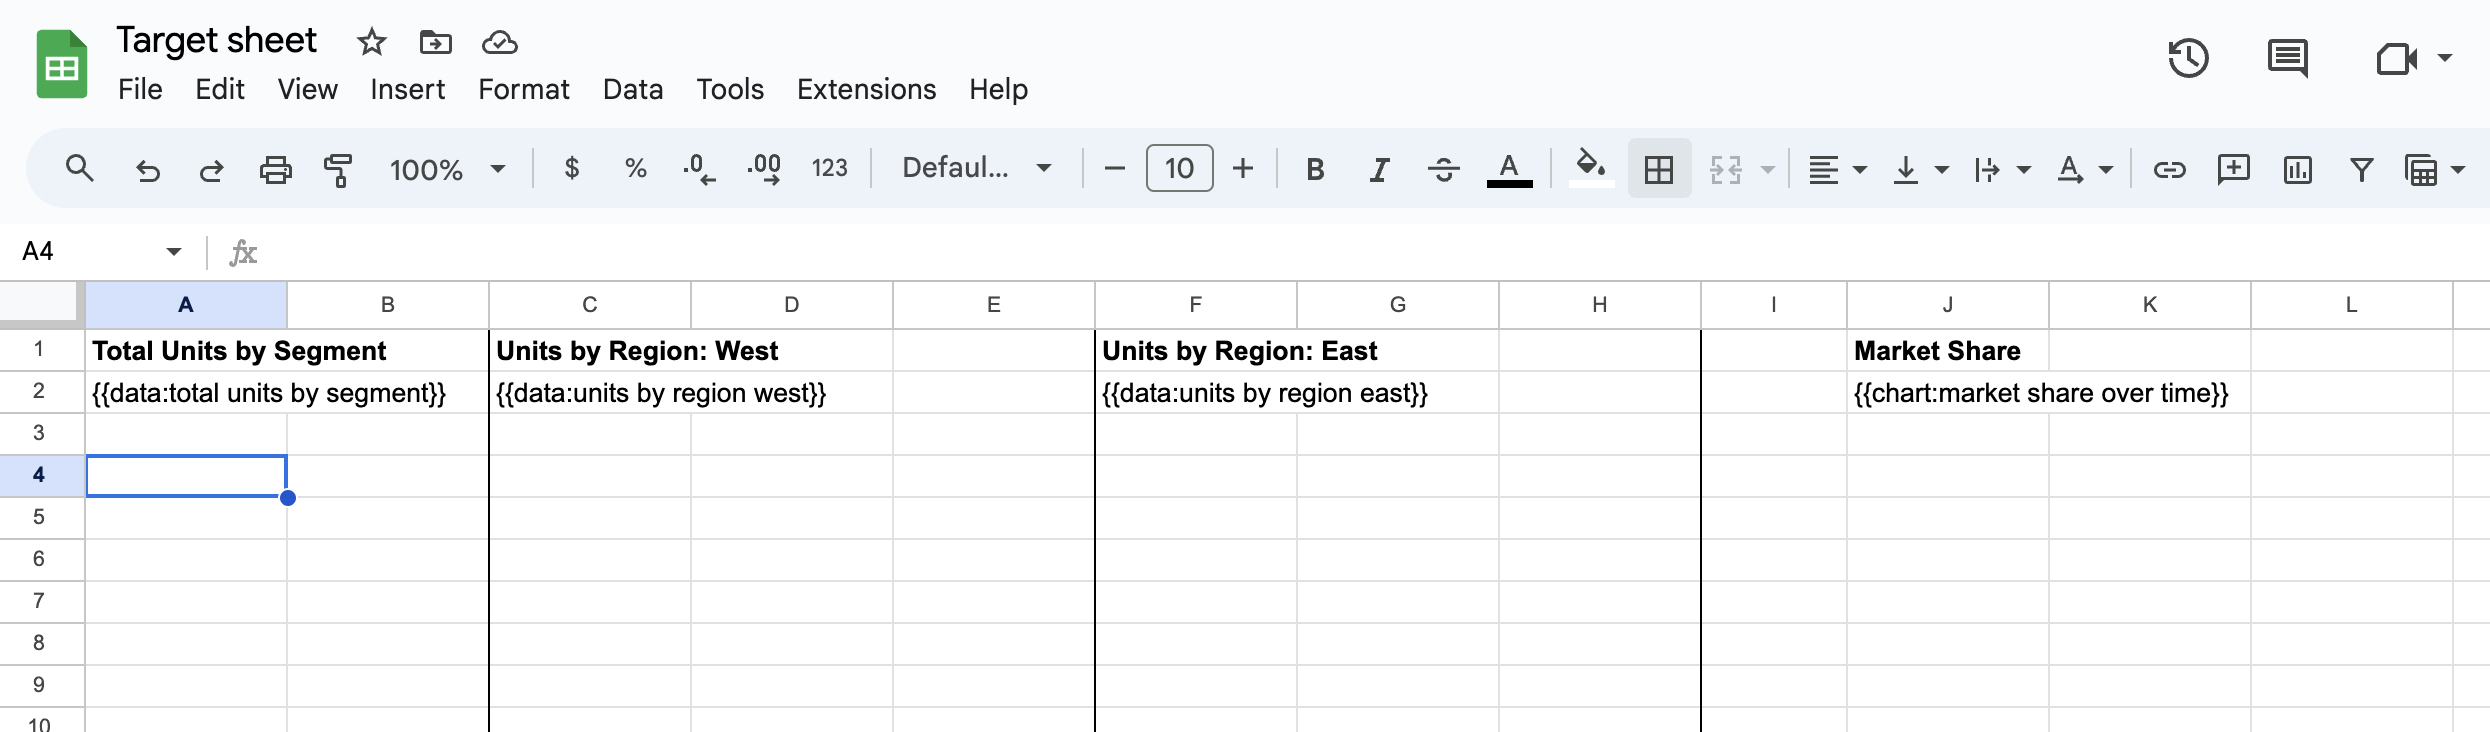
With Slideform, you can specify filters and layout of the data and also pull data from different data sources into the same sheet!
Save the template in your Google Drive workspace, then connect your Google Drive to Slideform and set up a new project.
3. Match data to placeholders in the sheet
The final step is to match each placeholder pragma to the appropriate data. Set the data source for each pragma in the Configure Data section of the project.
Slideform can do complex data filtering and lookups too! For example, the Units by Region data can be filtered by Region, so we have separate tables for the West and East Regions in the output sheet.
For more information see: How to Configure the Data Mapping. You can embed charts, text, images, numbers, percents and more from a variety of data sources.
4. Generate the presentation
Once the data and template are connected, you can trigger a data export to the spreadsheet anytime by clicking Generate. Or you can set a schedule to run the export and email you the results. In Settings you have the option to create a new output sheet each time, or to overwrite an existing Google Sheet.
With an automated workflow, you can pull in the data you need for further analysis and manipulation. Add to the workflow by importing the spreadsheet data directly into reports and presentations.
Did you know? Slideform automatically embeds Power BI data into Google Slides and PowerPoint too!
Want a free trial?