Bridging the gap between dashboards and presentations is a challenge. Slideform seamlessly integrates dashboards, charts, spreadsheets, images, and other content into your custom presentation template, saving you time and costly errors.
In this tutorial, I will show you how to automatically pull Looker visuals into Google Slides & PowerPoint. With Slideform, you can easily generate custom presentations from your dashboard and combine Looker data with other content seamlessly.
Looker Studio and Looker are two different products, and Slideform integrates with both!
Looker Studio is a visualization and reporting tool, designed for building and sharing dashboards. Looker Studio is basically Google Data Studio rebranded as part of the Looker product family. And Looker Studio is free! Learn more about linking Looker Studio to your Presentations.
Looker (Classic) is a fully-fledged BI platform where you can create and manage content (Looks, Dashboards, etc.). It is more sophisticated than Looker Studio and more expensive. This article is about connecting Looker visuals to slides, so read on!
Why Embed Looker Dashboards into Google Slides?
In the era of data-driven decision-making, Looker has emerged as a powerful tool, offering a sophisticated BI suite and insightful dashboards for a variety of data sources. However, bridging the gap between these data-rich dashboards and compelling presentations has often been a challenge—until now. Enter Slideform, the innovative solution that generates your custom presentations automatically, transforming the way you share and present data insights.
Looker is renowned for its ability to visualize and analyze data effectively. Still, when it comes time to present this data to clients and stakeholders, the traditional slide deck is the preferred format for most organizations. Methods to import Looker charts into slides are very limited, and manually copying screenshots is cumbersome. Slideform bridges the gap between dashboards and slides, allowing you to seamlessly integrate Looker visuals into your presentations.
How to pull Looker visuals into your slide deck
- Connect Looker to Slideform
- Upload your slide template
- Map Looker visuals to your template
- Generate and save the presentation
Step 1: Connect Looker to Slideform
The first step is to connect your Looker dashboard to Slideform. Log in to Slideform, click on "Add Data Source," and link your Looker dashboard using the API key. This secure connection ensures that your dashboard elements are readily accessible for embedding into your presentations. See the article How to Connect a Data Source for details on how to connect your Looker instance.
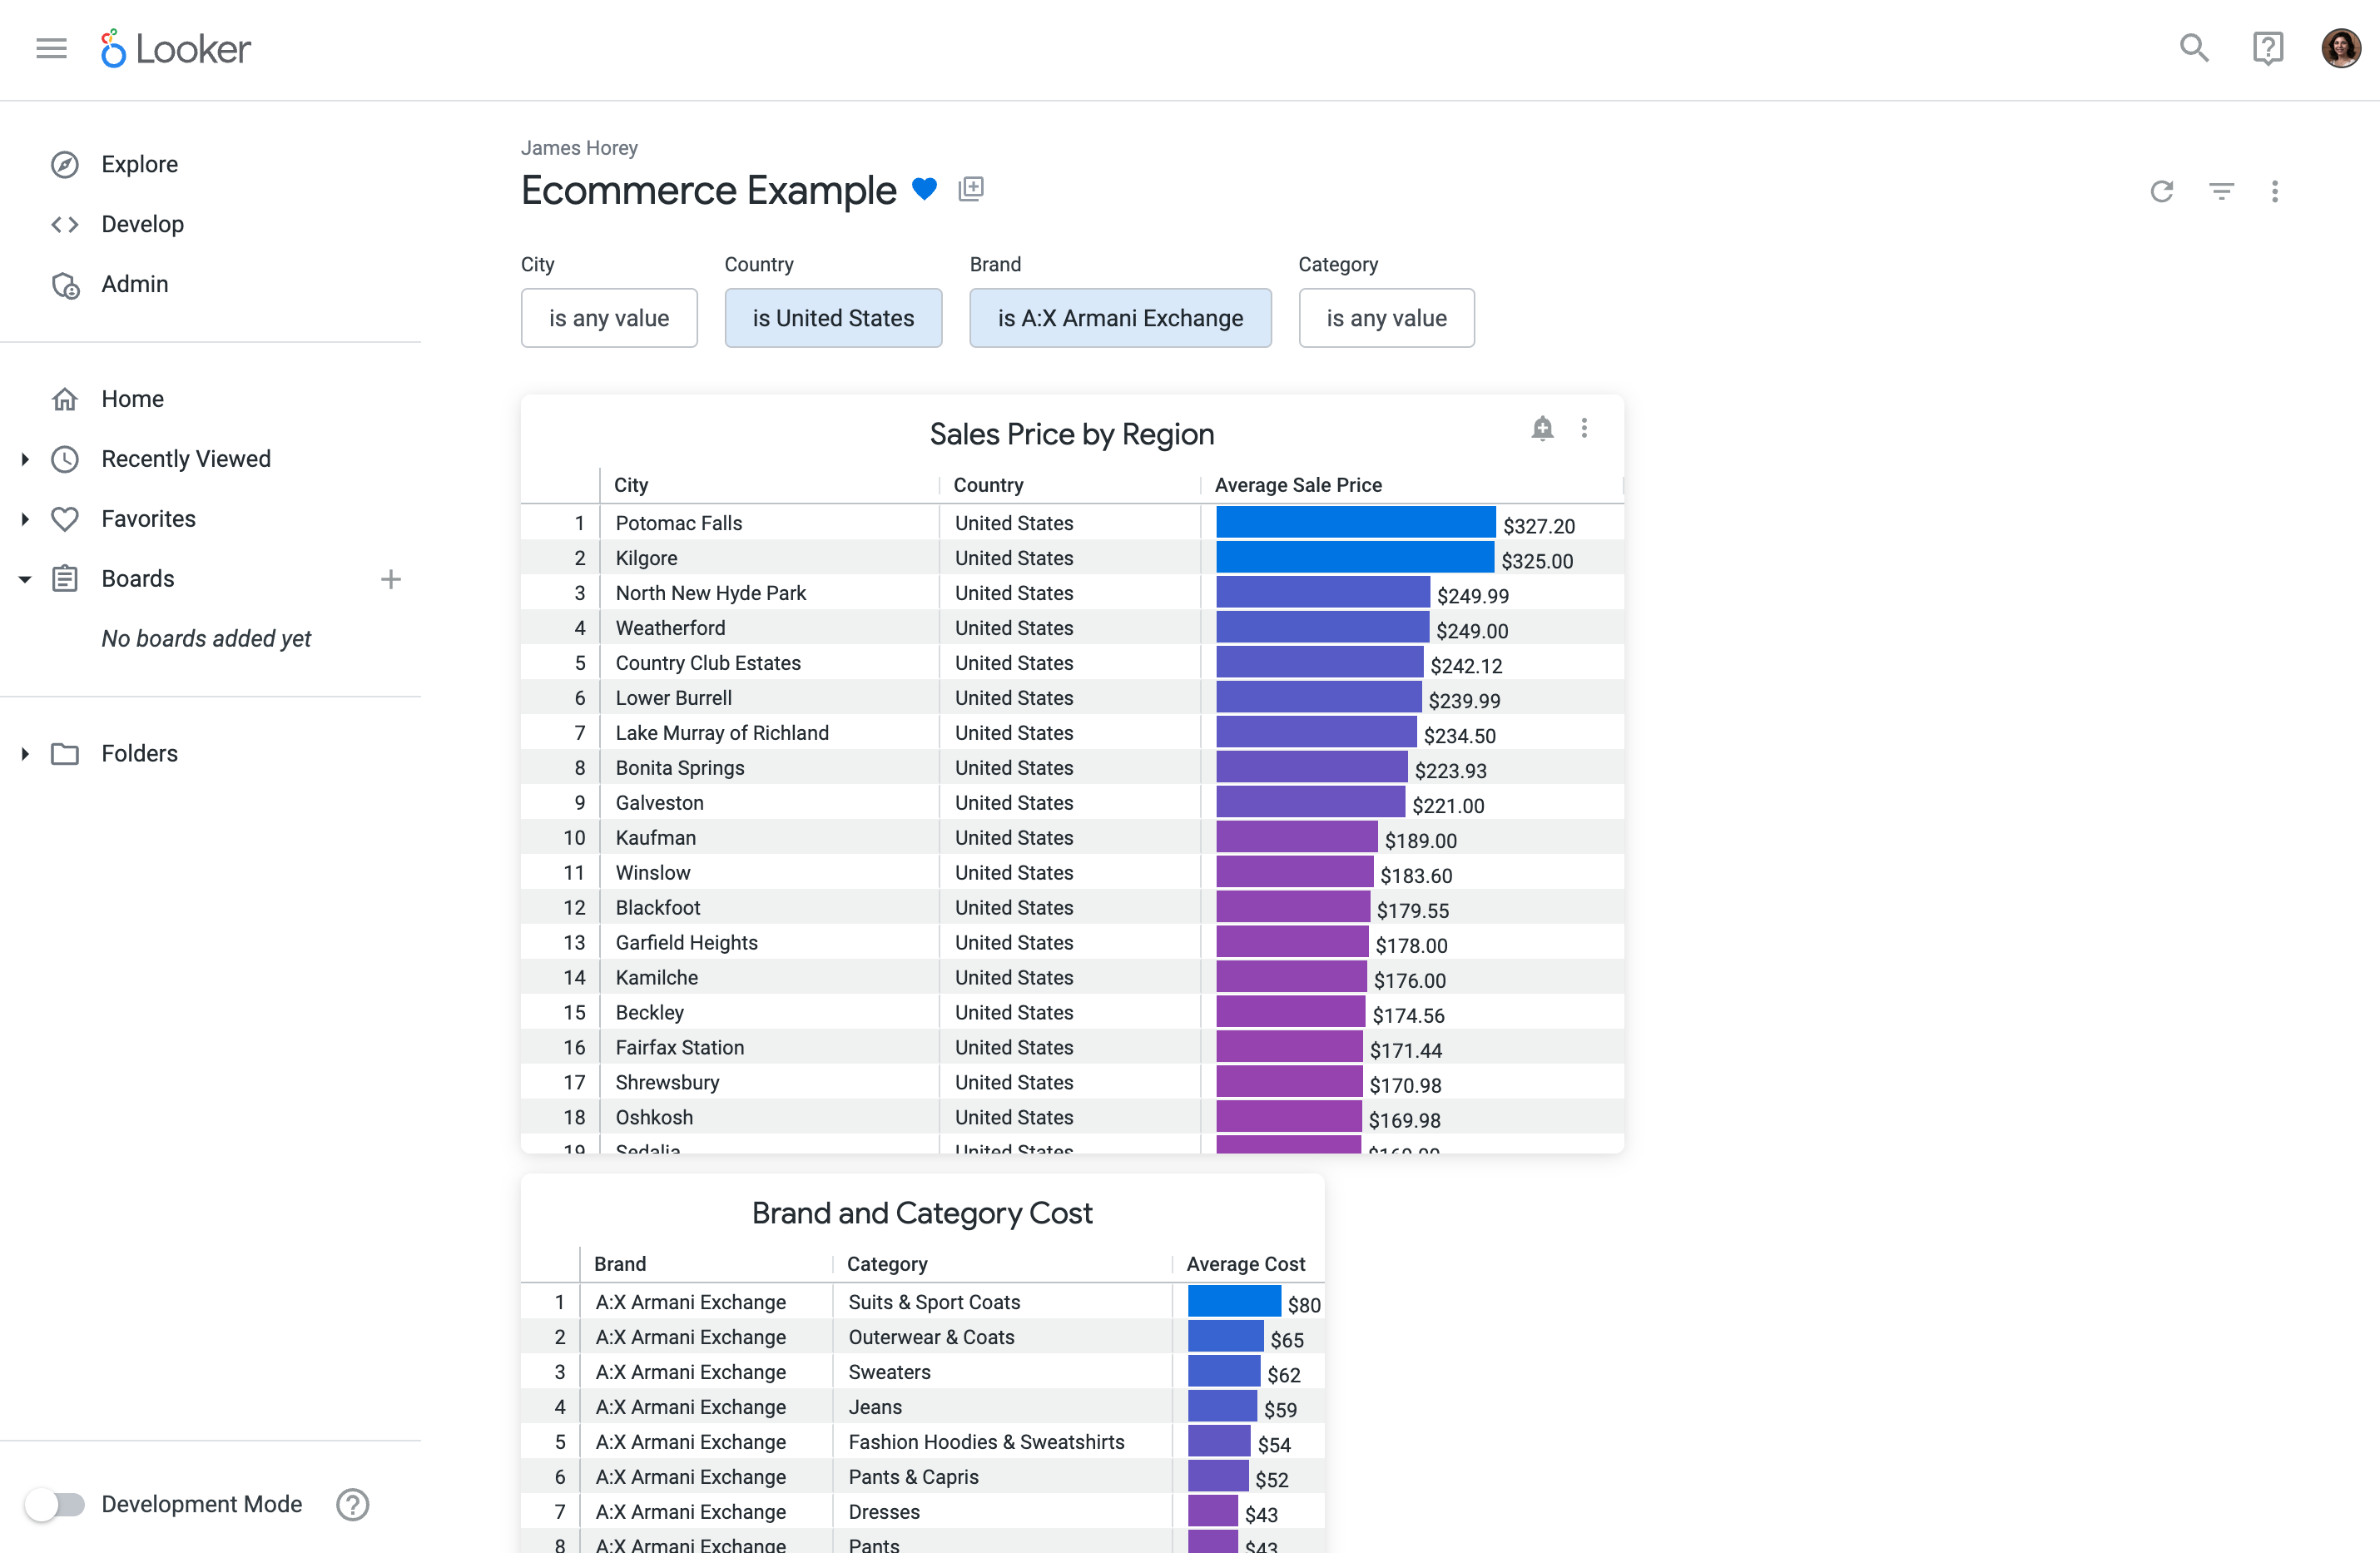
Let's take a look at my Looker dashboard. I would like to embed these two charts (Looks) into a slide deck for our quarterly report. All you have to do is make sure each chart or visual has a descriptive name or title in Looker.
Step 2: Upload your slide template
Next, you need a template for your presentation. With Slideform, you can use your own custom-branded slide template in the format of your choice, PowerPoint or Google Slides. Just start with a previous version of the report and insert placeholders for any elements that will change between versions of the report, including text, numbers, images, charts, logos, and names. You can find a detailed explanation of the template in our help center. Templates are easily shared between team members too.
Here is one slide from my template.
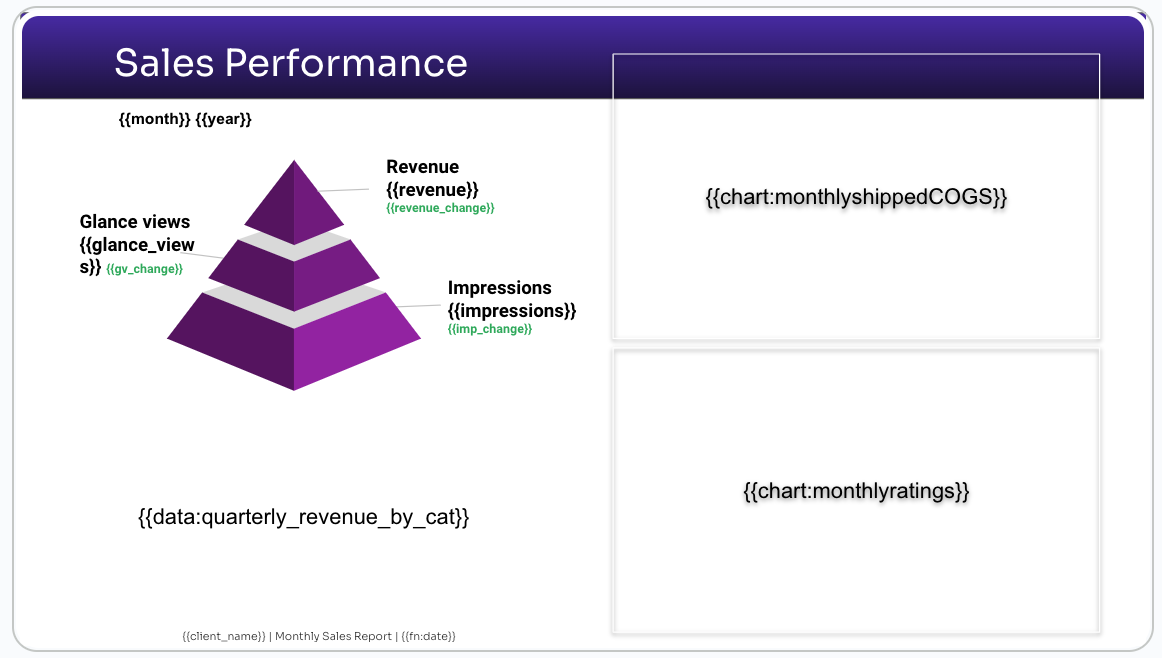
In the slide deck template, placeholders are denoted by curly braces, and the two chart placeholders are contained inside rectangles. the data placeholder will be filled with a table from our connected Google Sheet. All the colors, styling, fonts, and sizing of the elements in the template will be carried through to the slide deck output.
In Slideform, go to New Project to connect your slide template. I used Google Slides, but you can also upload a PowerPoint template. Give your project a name and connect it to the Looker data source in the Data Sources tab at the top of the Project page. Remember to save your project!
Step 3: Map Looker visuals to your template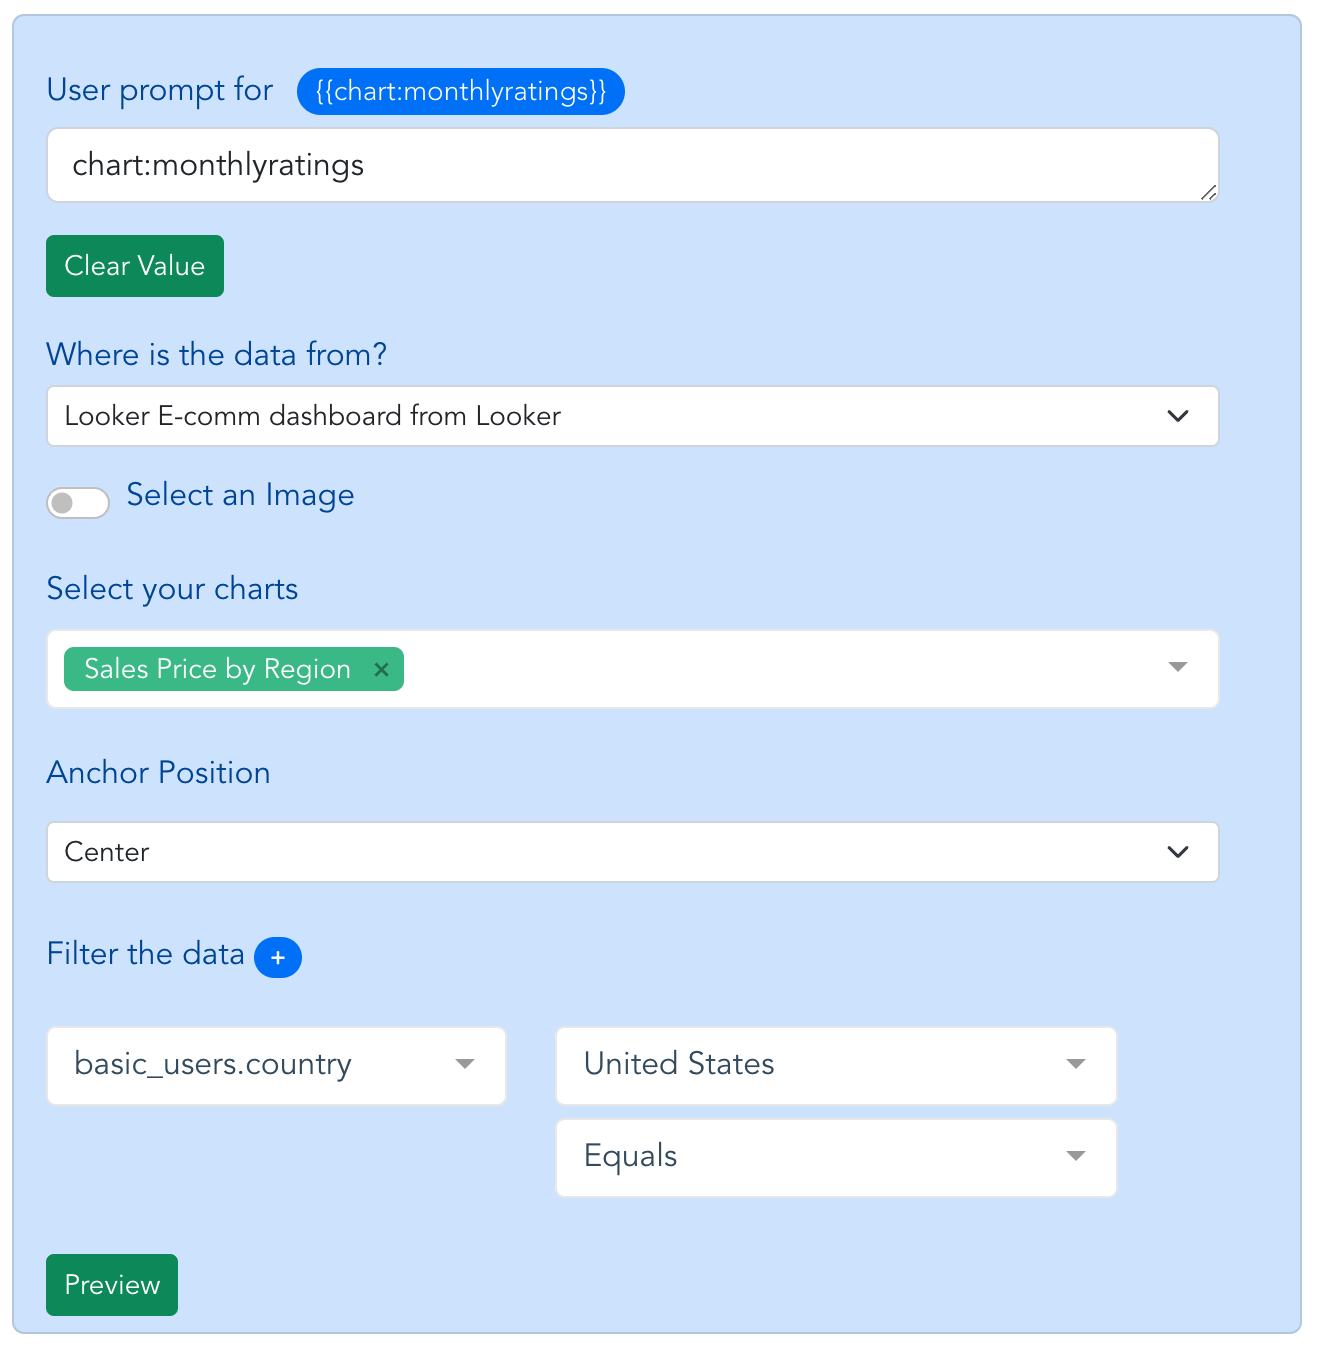
We need to match each placeholder in the slide template to the correct chart or content that will fill it. Open the project for editing by clicking Configure Data on the project card.
Each placeholder from the template is shown on a blue card. Let's look at the {{chart: monthlyratings}} placeholder. We choose Preset a value and select the Looker data source, then choose the chart by name and set the anchor position. We can also filter the data with any filters that are included in the Look. Now this placeholder shape in the template will always be filled by the latest version of this chart.
In my example template, I also have placeholders for text, images, and page numbers. I will pull in these data from other sources, including Google Sheets and Google Drive.
With Slideform, it is super simple to pull data and content from more than one source and include them in a single presentation.
Once you have configured the mapping, save your project. 😉
Step 4: Generate and save the presentation
Generate a slide deck from your Looker dashboard by clicking Generate on the project card. If you did not preset the values for all placeholders, you will be prompted to fill them in now.
Next you will see a preview of your output slide deck. If everything looks right, you can save the presentation to Google Slides or download the file as PowerPoint or PDF. The download will appear on your Projects page.
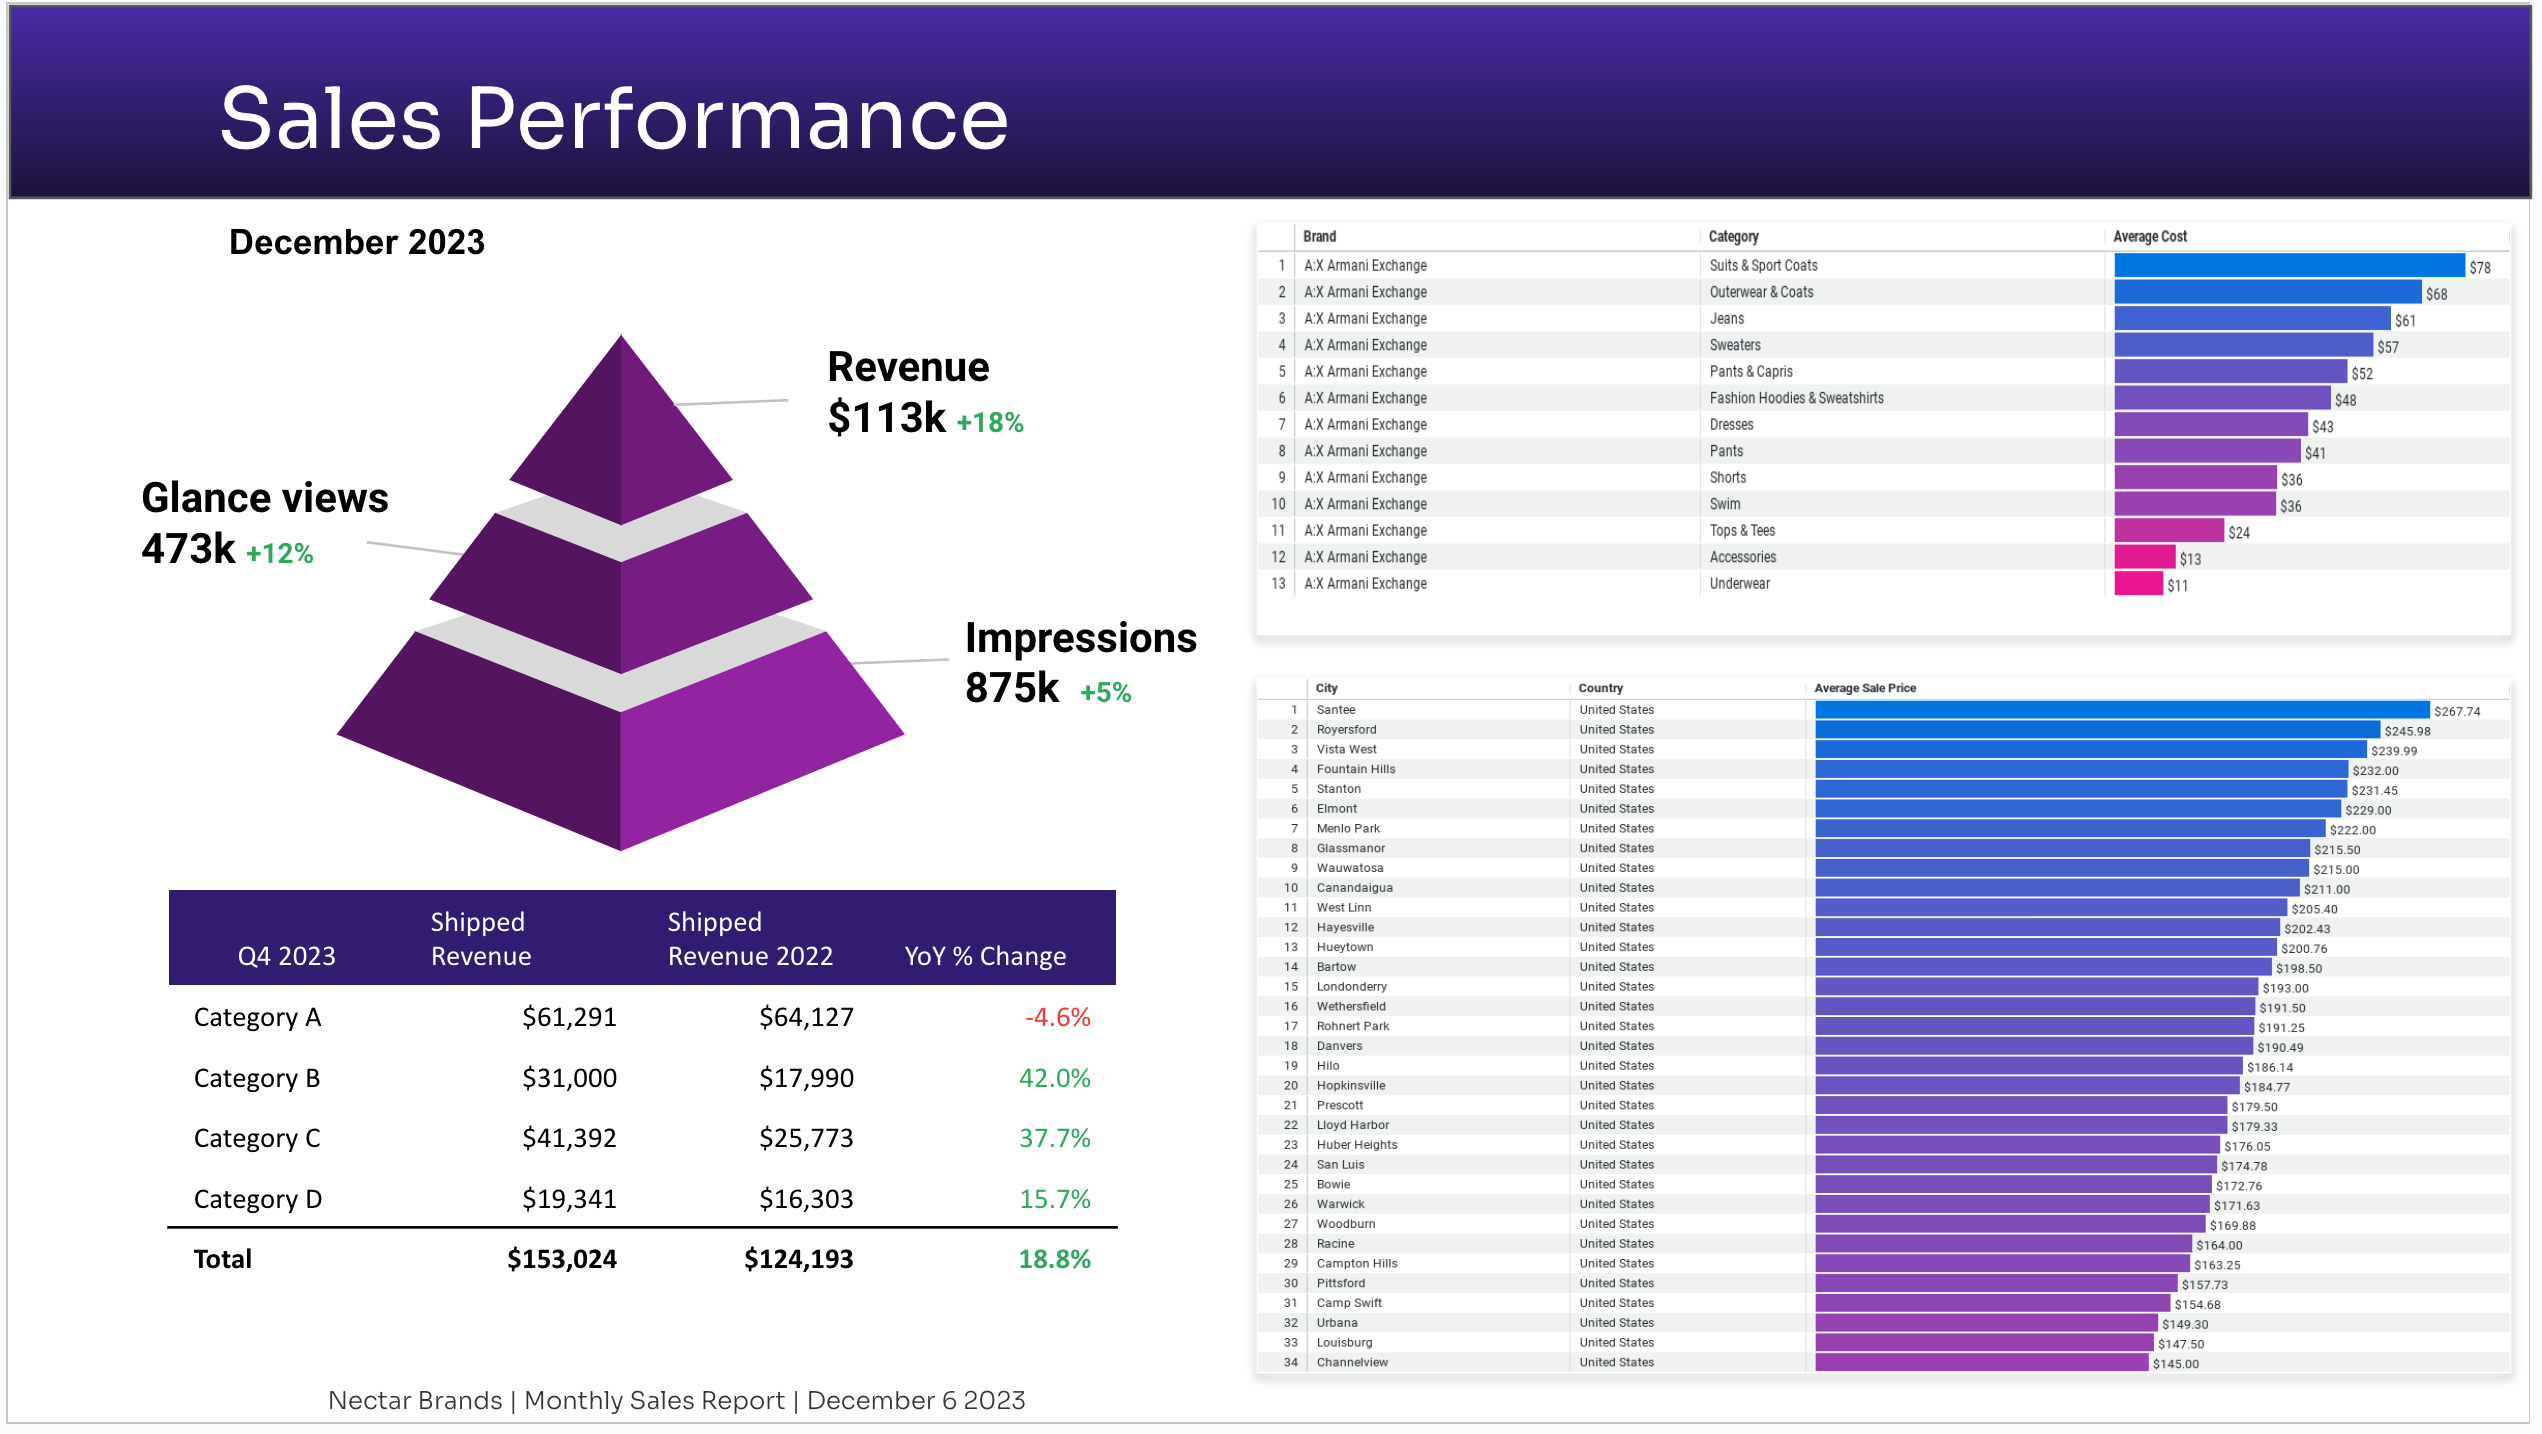
Check out my Google Slides output below. The styling, colors, fonts, and layout are preserved while the charts are filled in from Looker and the data table and KPIs are pulled from Google Sheets!
Advantages of using Slideform to connect Looker to slides
- Efficiency: Say goodbye to manual screenshots and copying-pasting.
- Flexibility: Combine Looker visuals with other content and data from a wide variety of sources dynamically.
- Dynamic Updates: Data visuals update when you re-generate, reflecting real-time changes.
- Customization: Tailor your presentations with your own branded templates.
- Format Neutral: Generate output in Google Slides, PowerPoint, Word, Google Docs, or even PDF.
Get in touch today and try Slideform for free

You may also like:
How to get data from a dashboard into a presentation
Export Power BI visuals to PowerPoint or Google Slides