Updated Nov 11, 2025
In this tutorial, I'll show you how to export charts and data from Looker Studio (previously known as Google Data Studio) into PowerPoint. Slideform's Looker Studio integration makes it easy to embed individual text metrics, images, data tables, and charts from Looker Studio into slide decks and reports.
New: You can also use Slideform to create new visuals and insights from your Looker Studio data with a simple prompt.
Prefer to watch the video tutorial?
Explore Slideform's Looker Studio Integration
Why present Looker Studio data in PowerPoint?
Looker Studio is an affordable and easy-to-use dashboard solution. However, the challenge arises when you need to present these charts and metrics in a slide deck, presentation, or report. Traditional methods such as screenshots and manual copying can be time-consuming and inefficient.
If you need to customize the colors or layout of your Looker Studio charts for a specific client, it can be even more difficult. That's where Slideform comes in. Slideform bridges the gap between dashboards and reports. Slideform connects to Looker Studio to generate customized, dynamic reports on your template, including visuals directly from Looker Studio and AI-generated summaries, insights, and charts.
In this post, we'll examine how Slideform works with Looker Studio, how it differs from other AI tools, and how to set it up in just a few steps.
How to embed Looker Studio into PowerPoint
- 1. Create a PowerPoint Template
- 2. Connect Looker Studio to Slideform
- 3. Create new visuals and insights
- 4. Match the Data to the Template
- 5. Generate the PowerPoint Presentation or set a Schedule
Step 1: Create a Customized Template for your PowerPoint Deck
The first step towards automating your report is to make a custom template for the slide deck in PowerPoint. It is useful to use a previous report as a guide. The slide's look & feel should align with your company's branding, colors, and presentation style. Use any colors, fonts, and images you want. All the styling will be carried through to the final output.
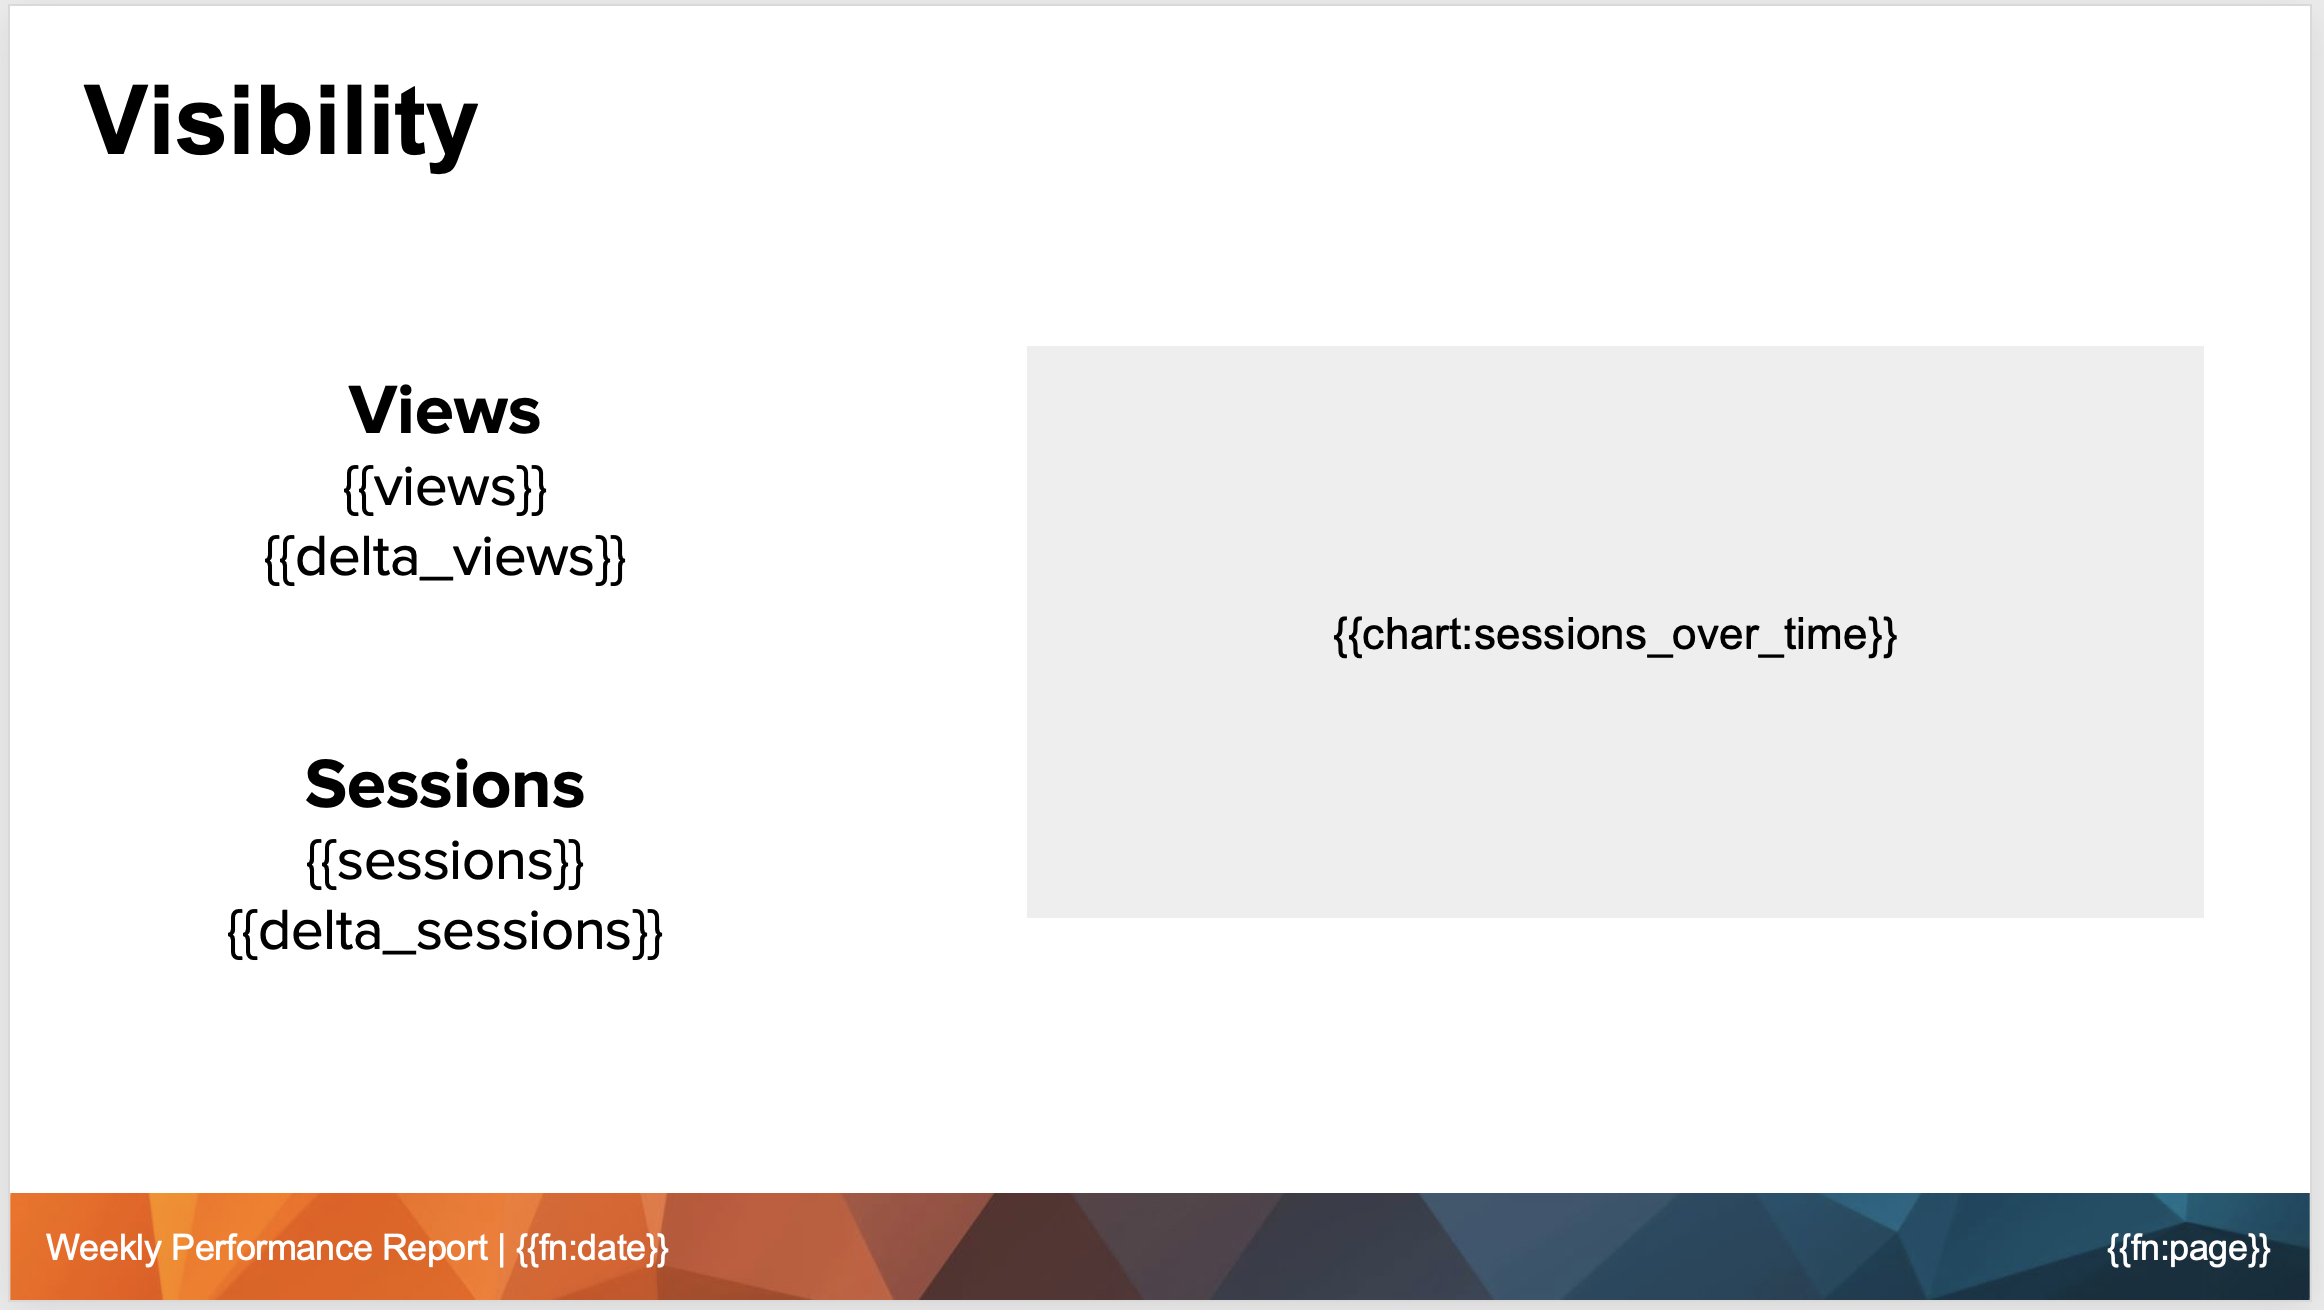
Create placeholders for the data from Looker Studio. To include text or numbers from the dashboard, just add a text box with a placeholder like {{views}}. This text will be replaced with the text or number from the dashboard.
For charts, use a PowerPoint shape (rectangle, square, or even circle) to indicate the placement and size of the chart. Then click into the shape and insert a placeholder like {{chart:sessions_over_time}}. These placeholders serve as dynamic containers that automatically update with the latest data, ensuring your presentations are always up-to-date.
Pull data from the dashboard into a PowerPoint table using a rectangle placeholder like {{data:top 5 channels}}.
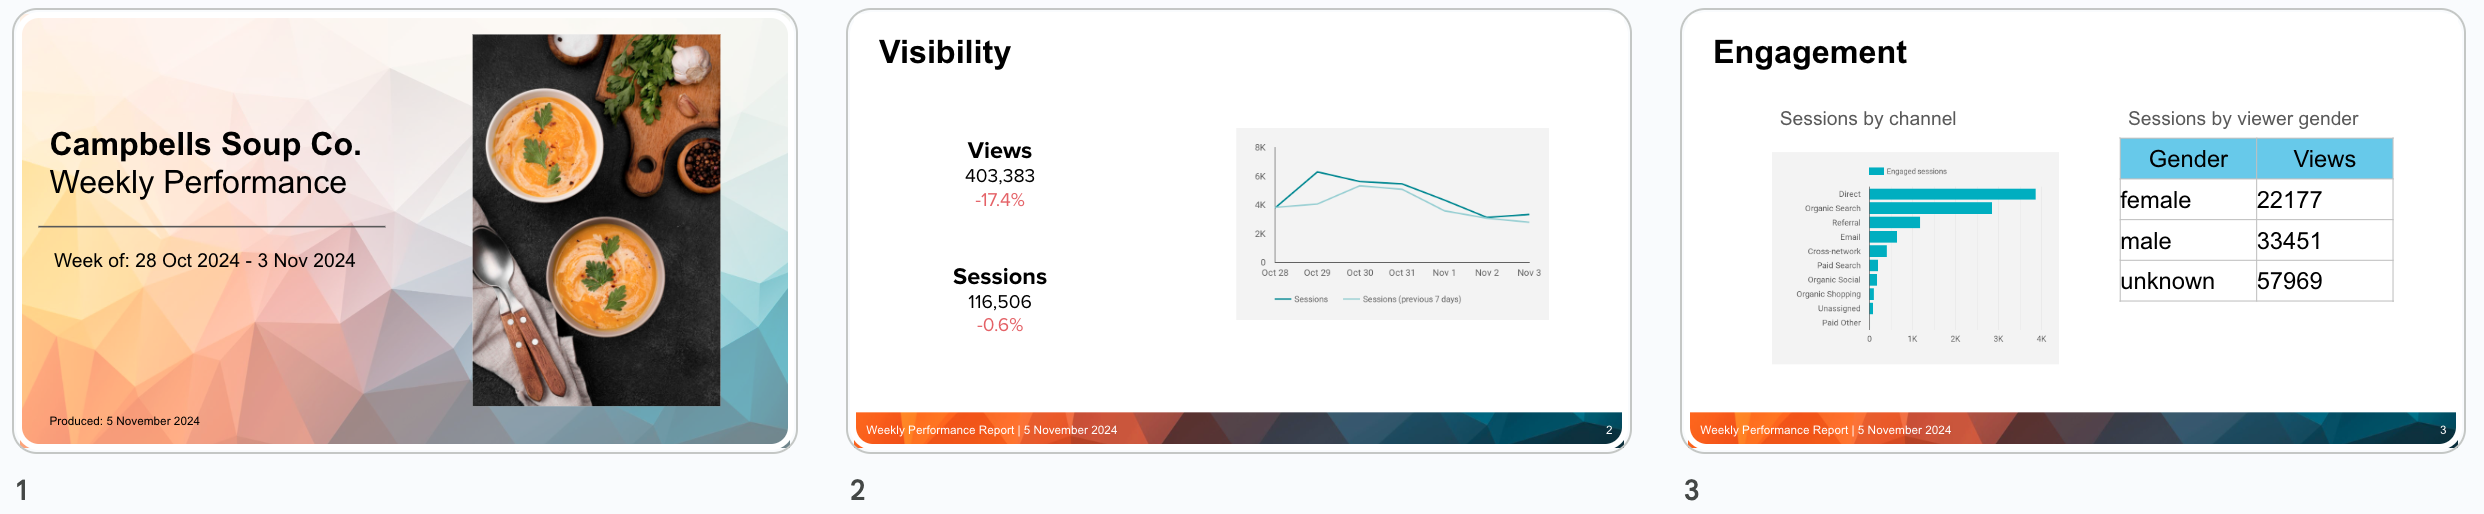
For this tutorial, I'll create a PowerPoint presentation with GA4 Analytics from my Looker Studio dashboard. Here's one slide from my template.
Once you've saved your slide deck template as a PowerPoint file, click New Project in Slideform and upload it.
Step 2: Connect Looker Studio to Slideform
Slideform works by pulling in your entire Looker Studio dashboard and all elements (charts, scorecards, KPIs, tables, images, & filters) for use in your slides.
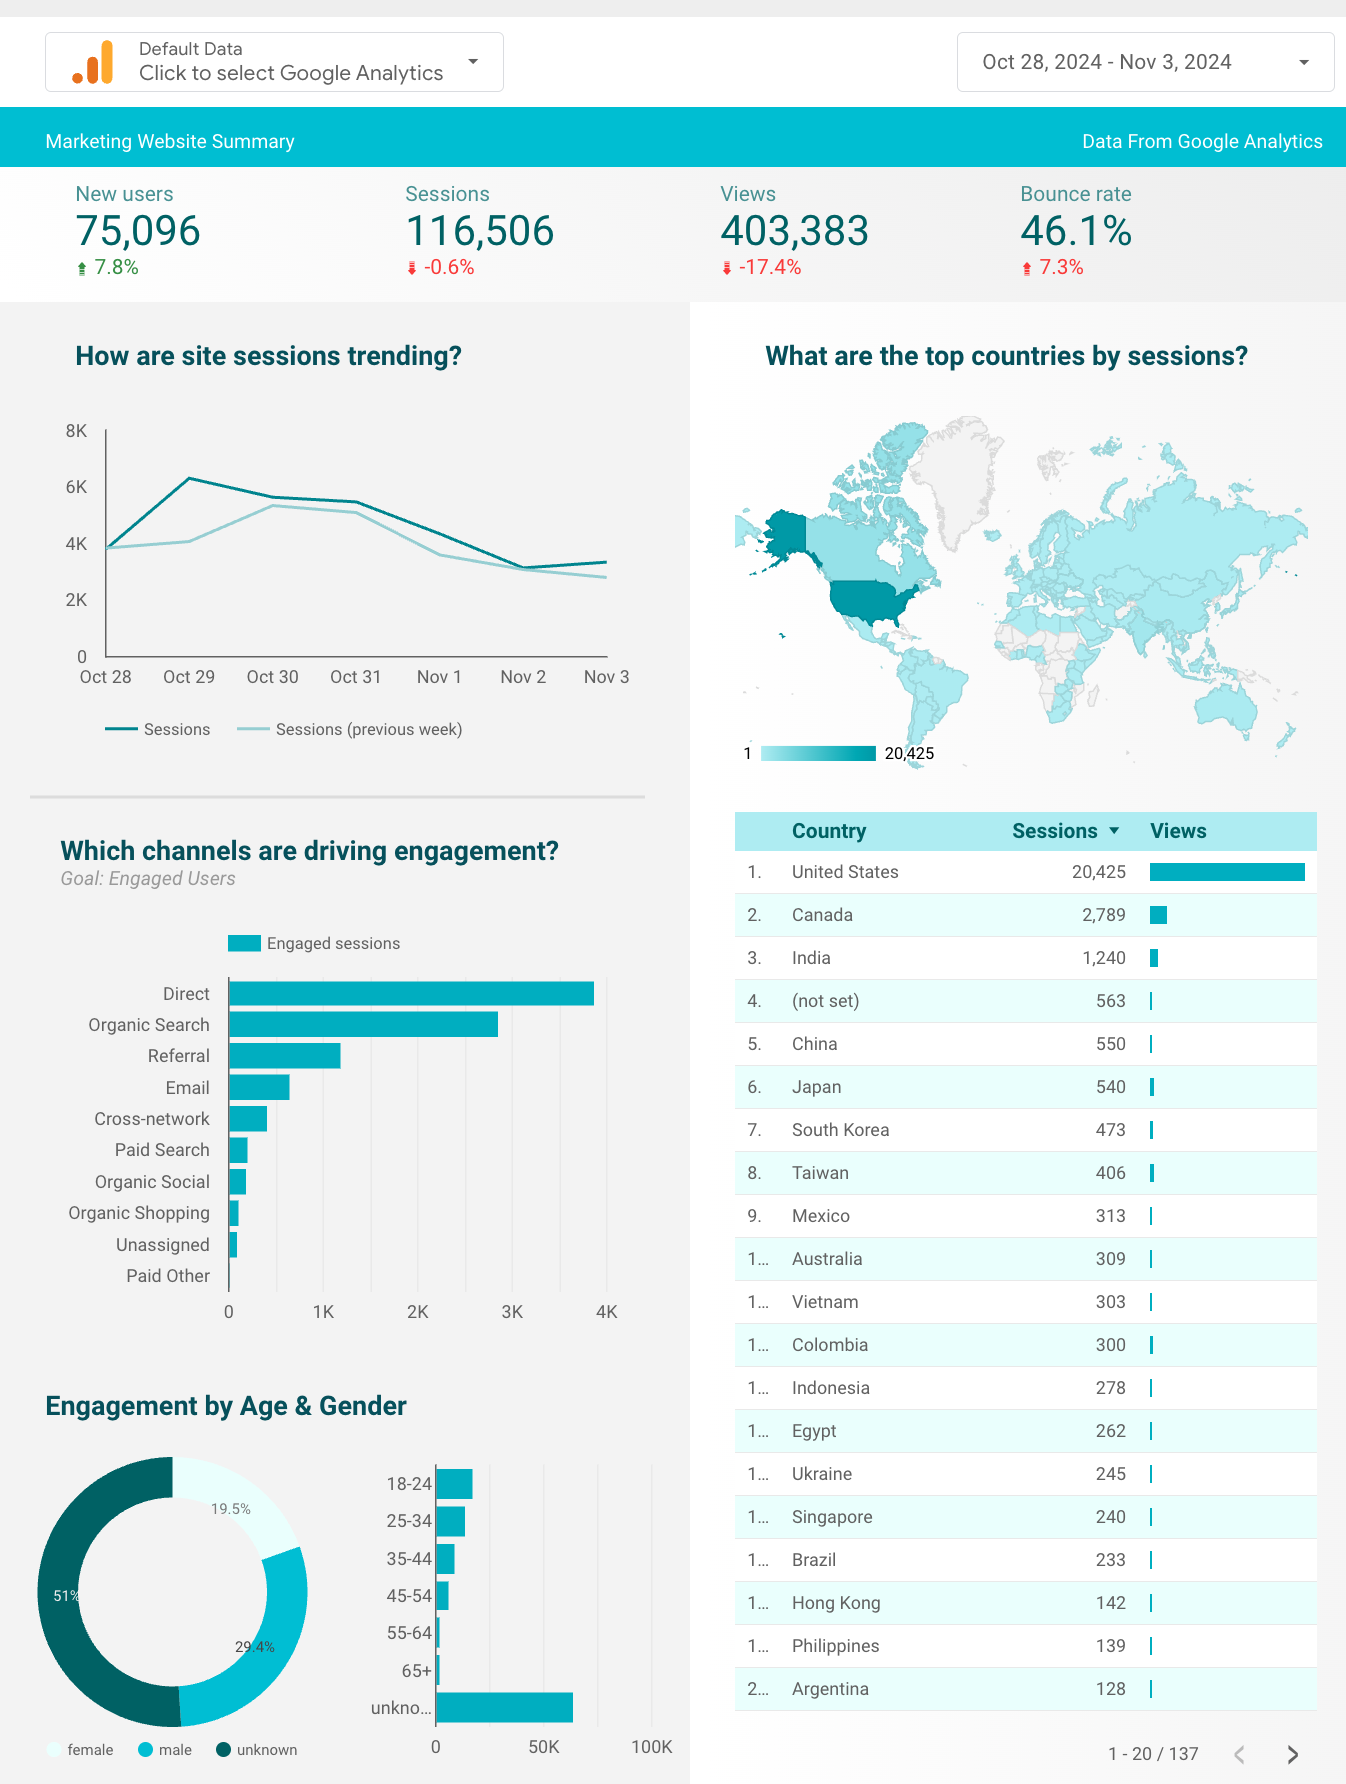
For example, let's look at a sample Google Analytics dashboard. Here is a view of the main dashboard page. I need to embed charts and metrics from this page into my weekly performance report for each client.
1. To connect this dashboard to Slideform, first, open your Looker Studio dashboard. Click Share and add viewer access for share@slideform.co. Make sure that Embed Report is enabled.
2. Log into Slideform and go to Data Sources > Add Data Source. Then under Looker Studio, click Add Integration. Copy the URL of the Looker Studio dashboard into Slideform. Its super simple to set up, and you'll always have the latest data available for your reports! For more details on setup, see How to Connect A Data Source.
Step 3. Create PowerPoint charts and insights with AI
If you need the change the colors or styling of one of the charts in Looker Studio for a client report, it can be really difficult to accomplish. Maybe you don't have access to edit Looker Studio, or you don't want to make changes that are visible to other users.
Now, you can use Slideform's AI assistant to create new Powerpoint content from the data in Looker Studio! For example, let's take this default chart of impressions over time from Looker Studio.
Original Chart
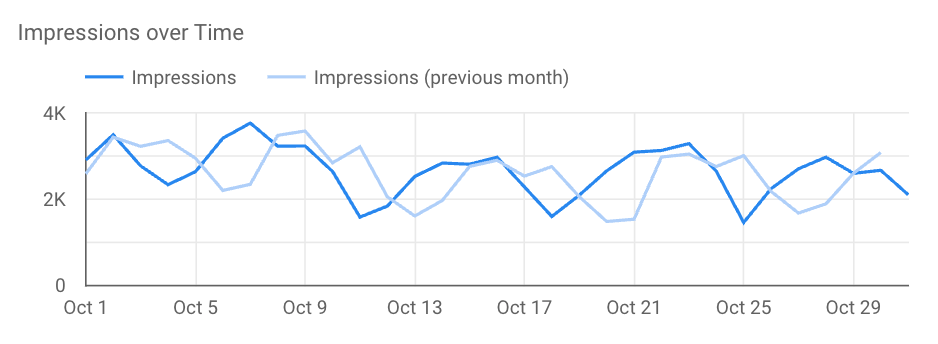
I want to change this to use the Slideform orange color scheme and to show the impressions grouped by week over a longer time range.
Just enter a prompt and create a new chart from the data in Looker Studio. My example prompt is:
Prompt: "Create a line chart of the number of impressions each week
over the past 3 months. Display the x-axis labels at an angle so
they do not overlap."
Since Slideform already has access to the Looker Studio data, it can write a custom charting script to operate over that data and produce a new chart. It also follows the branding and color preferences that I've set up in my account. Here's the new, improved chart:
New Chart

The new chart is uses my color scheme, it has the impressions data grouped by week and covers a three-month date range. This is exactly what I needed, and I didn't have to edit the original dashboard in Looker Studio. The best part is that this new chart is saved in my Slideform account so I can embed it in my report. The chart will be updated with new data every time I run the report, and I don't need to enter the prompt again or do any manual formatting in PowerPoint.
Generate insights and bullet points from Looker Studio
Slideform's AI can also produce text insights or calculations. For example, to include a bullet point in my report explaining any trends in the number of impressions per week, I might enter the following prompt:
Prompt: "Examine the number of impressions per week over the past 3 months.
Identify any upward or downward trends in the data relative to the
baseline expectation of 10,000 impressions per week."
The AI uses a custom script to analyze the data from Looker Studio and provides the answer in sentence form, such as:
Result: "Weekly impressions were above the 10,000 baseline each week and are trending downward for the past 1 week."
This text can then be embedded in one of the placeholders in the report template. The best part is, the text will be updated based on the data each time the report is generated!
With Slideform it's less "chatting" and more results. Custom charts & insights are saved, repeatable analyses that update whenever you run the report.
Step 4: Match the Data to Your PowerPoint Template
With Looker Studio connected, it's time to map your data to the PowerPoint slides. In Slideform, click Configure Data, and match each placeholder to the corresponding data. Use the preview button to see the chart, table, or metric. 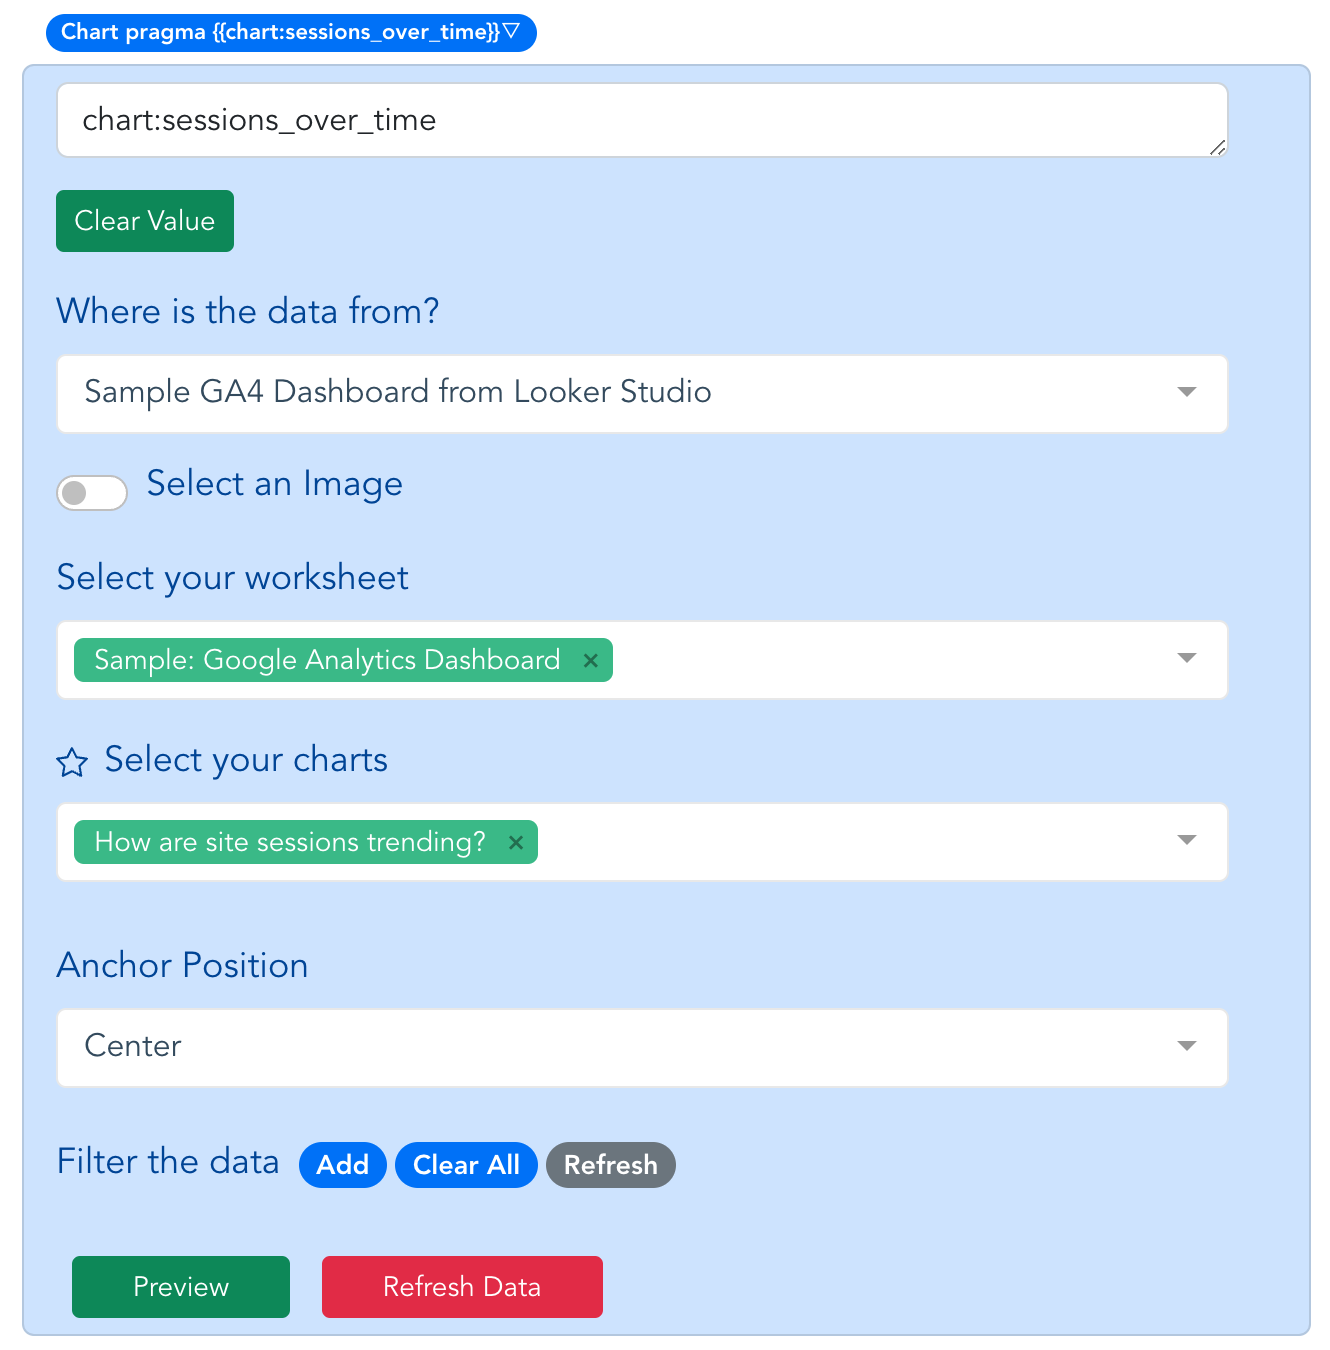
Let's look at {{chart:sessions_over_time}}. We select the data source (Looker Studio), then choose the worksheet or dashboard page, and select the chart.
To pull in a number, such as a KPI or metric, it is a similar process. Slideform captures the data behind each table and chart and you can filter and perform simple functions to select the data you want to use. For example, I can pull out the number of Views and embed it into the report in a text box.
Embed AI-generated Content: Embed content created by the AI Assistant into any placeholder by selecting it in the configuration options. It will update automatically as the data change.
Data Filtering: With Slideform, you control the filters dynamically, without having to go to the dashboard. You can filter the data with any filters that are included in your dashboard, such as date range, client, or campaign. You can filter the data for each chart separately, or you can set an overall filter for the report. Slideform supports custom date ranges, plus several built-in date ranges.
Step 5: Generate and Save Your PowerPoint Presentation
Generate a PPT deck from your Looker Studio dashboard by clicking Generate on the project card.
You can download the PowerPoint, save the deck to OneDrive or Sharepoint, or convert it to Google Slides or PDF. You can also Set a Schedule for Recurring Presentations to auto-generate and email the deck to you. Or you can create a batch of presentations, one for each client, with Slideform Bulk Mode. Awesome, right!
Check out my completed report! The styling, colors, fonts, and layout are preserved and the charts and metrics are filtered by week and filled in from Looker Studio!
Comparison with Gemini, ChatGPT and Existing Tools
There are a few ways teams try to solve the Looker Studio to Slides reporting problem today:
| Method | Feasibility |
|---|---|
| Manual screenshots | From Looker Studio, you can export a chart to image or PDF, or use a screen capture tool. Then insert the image into the slides. This approach is time-consuming, and often misaligned with brand guidelines. |
| Gemini plugin for Looker Studio | You can embed Looker Studio content (chart or table) as a Linked Object in Google Slides, then download the slides as a PowerPoint file. This may work for simple use cases, but this approach has limitations. It is not designed to switch between multiple clients or filters, there is no auto-update or scheduling functionality, and it cannot embed text or numeric values. |
| ChatGPT | ChatGPT cannot connect to Looker Studio. You would have to export the data and re-create the charts manually. ChatGPT can create simple PowerPoint slides for you, but the results vary. |
By contrast, Slideform's AI integration with Looker Studio offers the best of all worlds:
-
Direct Looker Studio integration with real-time data pulls
-
Templated, branded output in slide or document form with minimal effort
-
Can be triggered via Slideform app, API, or schedule
-
Handles chart rendering, text summaries, and layout placement automatically
-
Easily scaled—generate dozens or hundreds of customized reports at once
This approach is purpose-built for teams that need repeatable, structured, and client-ready reports, not just internal dashboards or generic AI "insights".
Slideform is the solution to connect Looker Studio to PowerPoint
- Efficiency: Say farewell to time-consuming screenshots and manual copying.
- Schedule Updates: Set a schedule to auto-generate reports, or create on demand.
- Powerful Filtering: Set dynamic filters and date ranges in Slideform without visiting the dashboard.
- Customization: Tailor your presentations with branded templates, images, and layouts.
- AI Analysis and Visualization: Create new charts, tables, and insights from the data.
- Format Flexibility: Generate output in PowerPoint, Google Slides, Google Docs, Word, or even a spreadsheet.
