The Slideform AI Analyst connects to live business data, creates charts and insights, maps them into branded templates, and generates presentations, emails, PDFs, and dashboards on demand or on a schedule.
Most AI tools can help with writing or generate a one-off deck from a prompt. The harder problem is recurring reporting: pulling fresh data, rebuilding charts and visuals, updating the narrative, preserving the template, and delivering the final output every week or month. That is the problem Slideform is built to solve.
GOAL: Use AI to create polished, data-driven deliverables from live business data without manually rebuilding charts, rewriting takeaways, or reformatting the same presentation over and over.
What is Slideform?
Slideform is the AI Analyst for business analytics and reporting. It connects dashboards, spreadsheets, CRMs, and other business data sources to branded outputs like Google Slides, PowerPoint, PDF reports, scheduled emails, and private dashboards.
Why We Built the Slideform AI Analyst
Most reporting workflows still look something like this:
- Open a dashboard, spreadsheet, or CRM.
- Export numbers, screenshots, or raw data.
- Paste them into PowerPoint or Google Slides.
- Rewrite the summary text by hand.
- Fix the formatting.
- Send the finished deck or email.
- Repeat next week.
It works, technically. But it is slow, repetitive, and hard to scale.
We wanted a workflow built for the actual reporting job: read live business data, calculate new metrics, create custom charts, write concise insights, fill reusable templates, and deliver polished outputs in the formats teams already use.
What the Slideform AI Analyst Can Do
The easiest way to understand the product is to look at the jobs it handles for you.
1. Analyze live data
The AI Analyst works with the data sources you already use, including dashboards, spreadsheets, and CRMs. Instead of manually calculating numbers or exporting CSVs, you can ask for what you need in natural language.
"Show me the top 10 customers by revenue growth this quarter."
"Create a table of deals closed won last week with owner, amount, and close date."
"Summarize the biggest changes in campaign performance month over month."
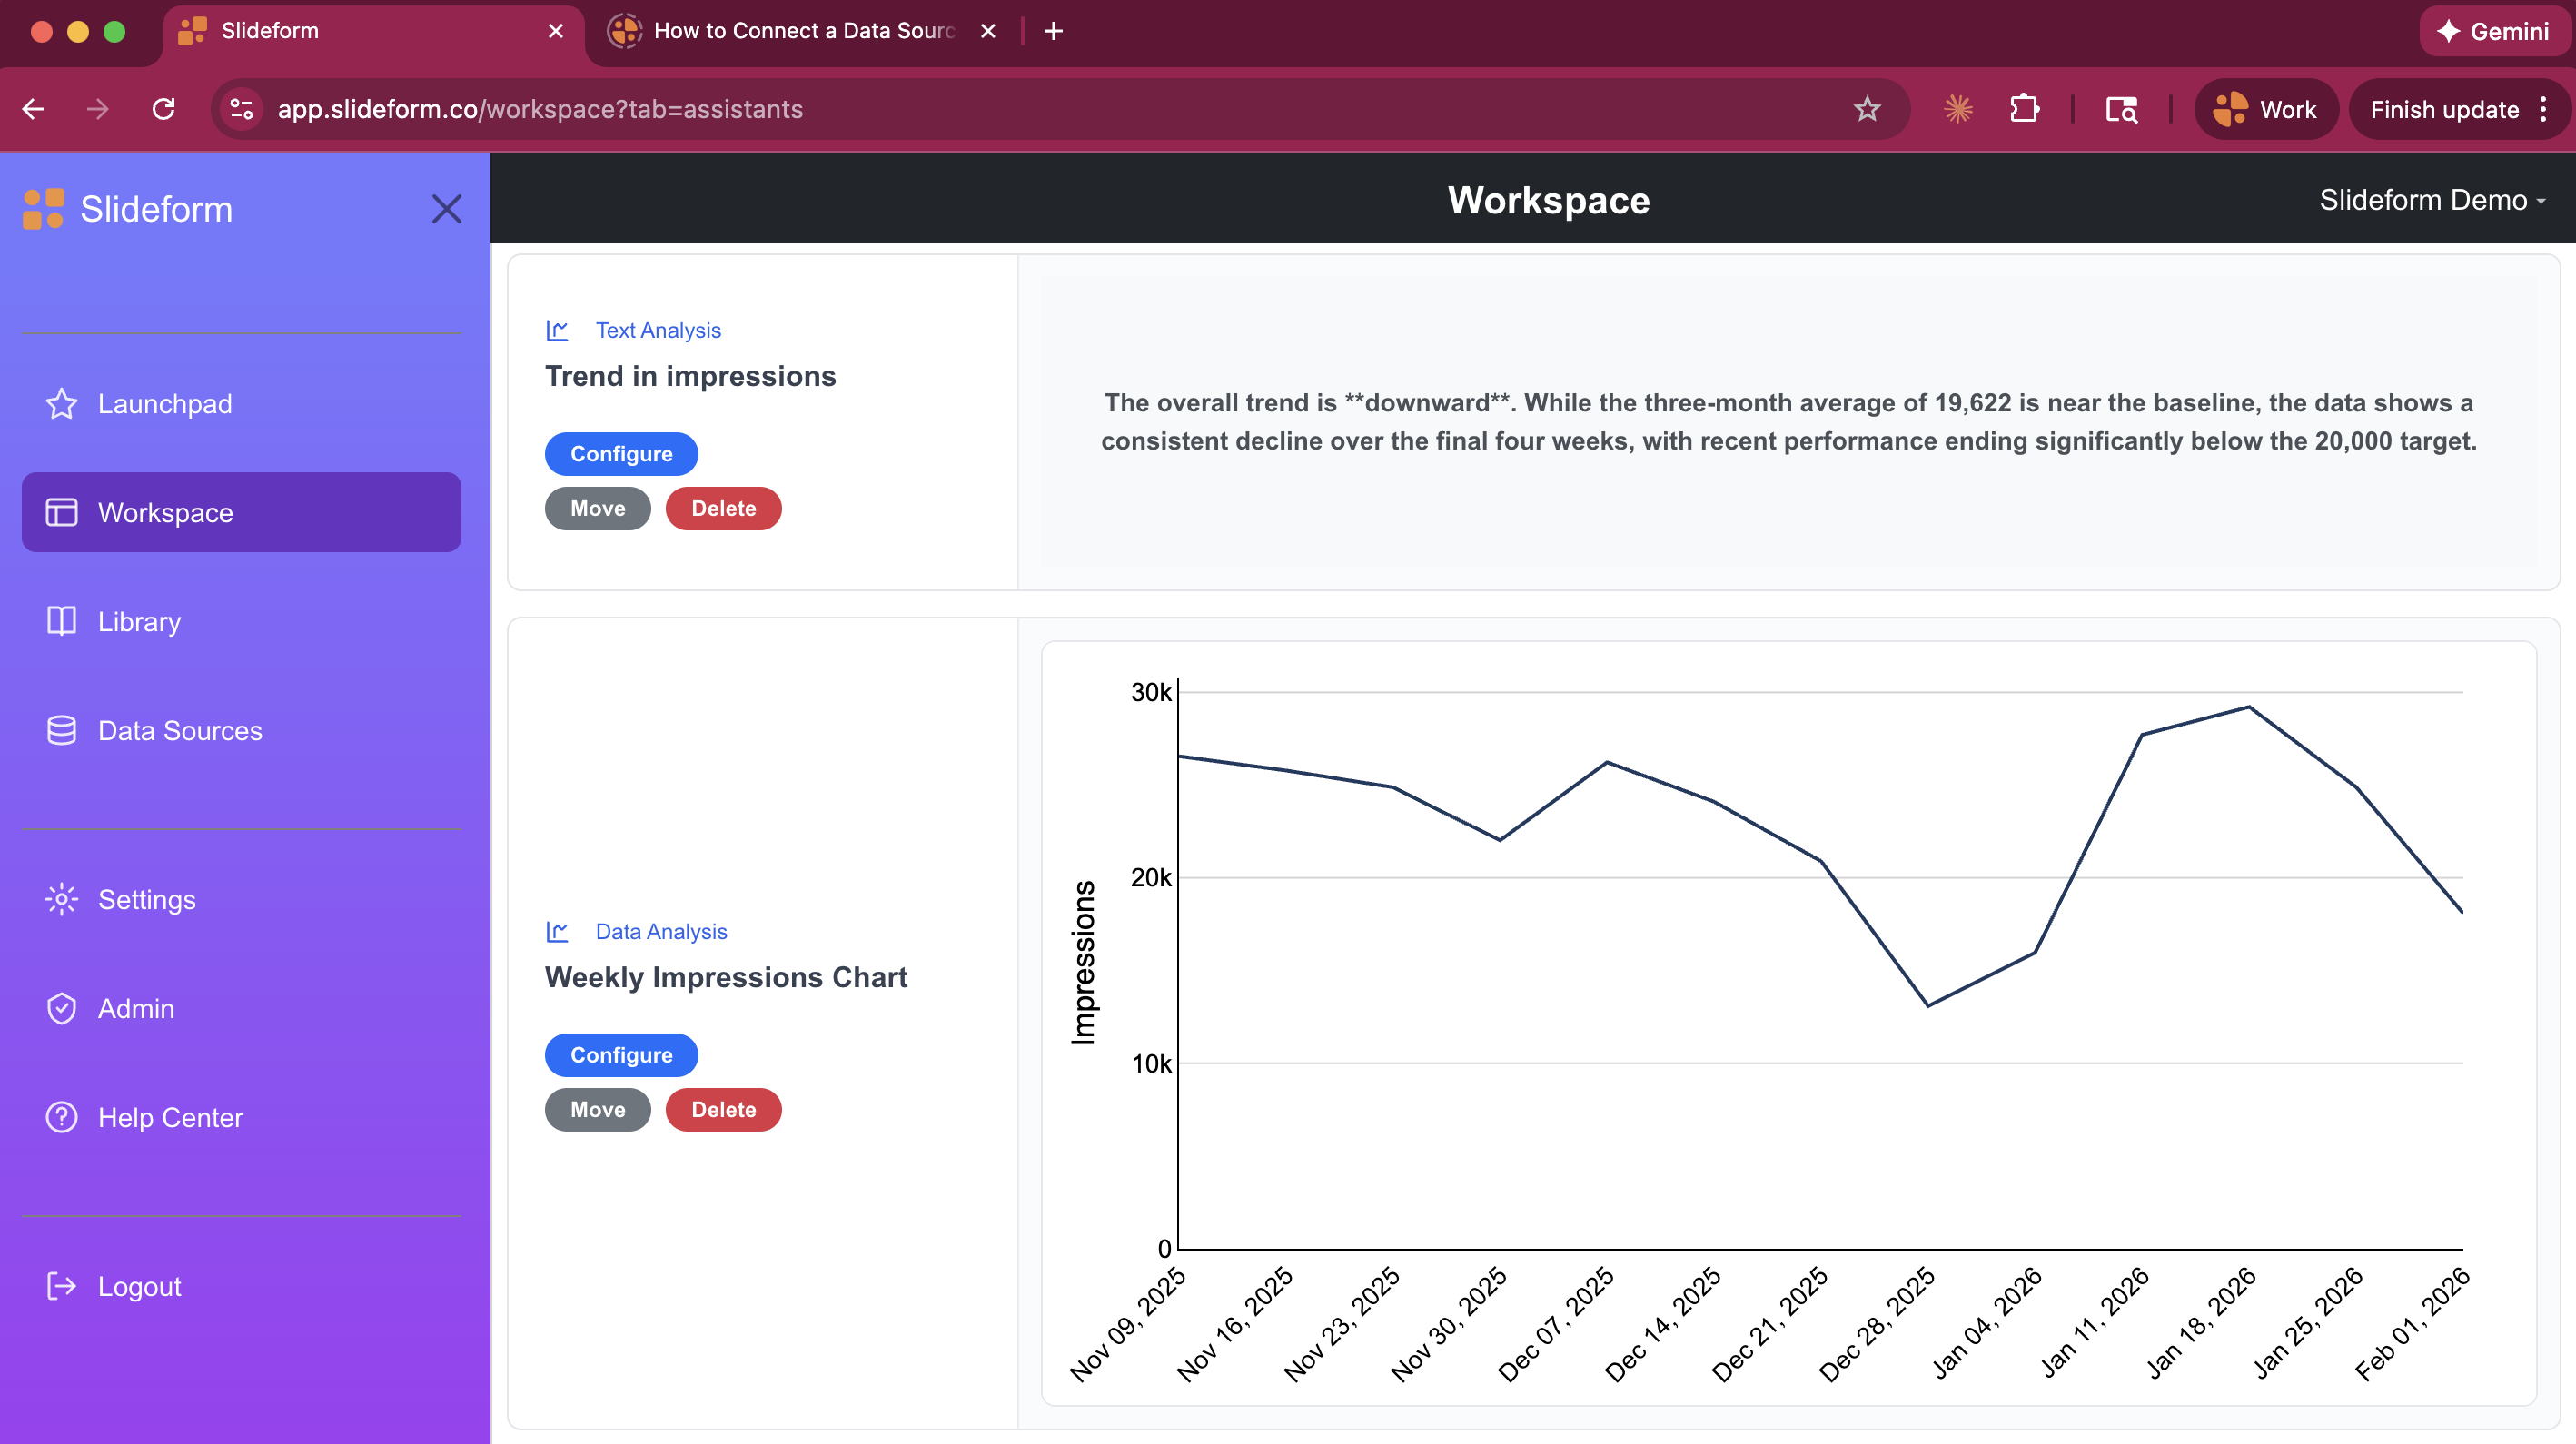
2. Create charts, tables, metrics, and KPIs
You are not limited to the visuals that already exist in a dashboard. The Slideform AI Analyst can recreate an existing chart with different colors or layout, build a new chart from connected data, create tables for slide-ready or email-ready output, and calculate metrics that are not already prebuilt in your reporting system.
3. Write summary text and insights
The AI Analyst can write short summaries, headlines, and takeaways based on the connected data so your report includes not just charts and tables, but also an explanation of what changed and why it matters.
- Executive summary paragraphs
- Slide headlines
- Chart annotations
- Email summaries
- Performance takeaways
4. Create or improve templates
Slideform works with the templates your team already needs. You can create a new template with AI, upload an existing deck and turn it into a reusable template, insert placeholders and pragmas like {{client_name}} and {{chart:pipeline_by_stage}}, and reuse one template across many clients or reporting cycles.
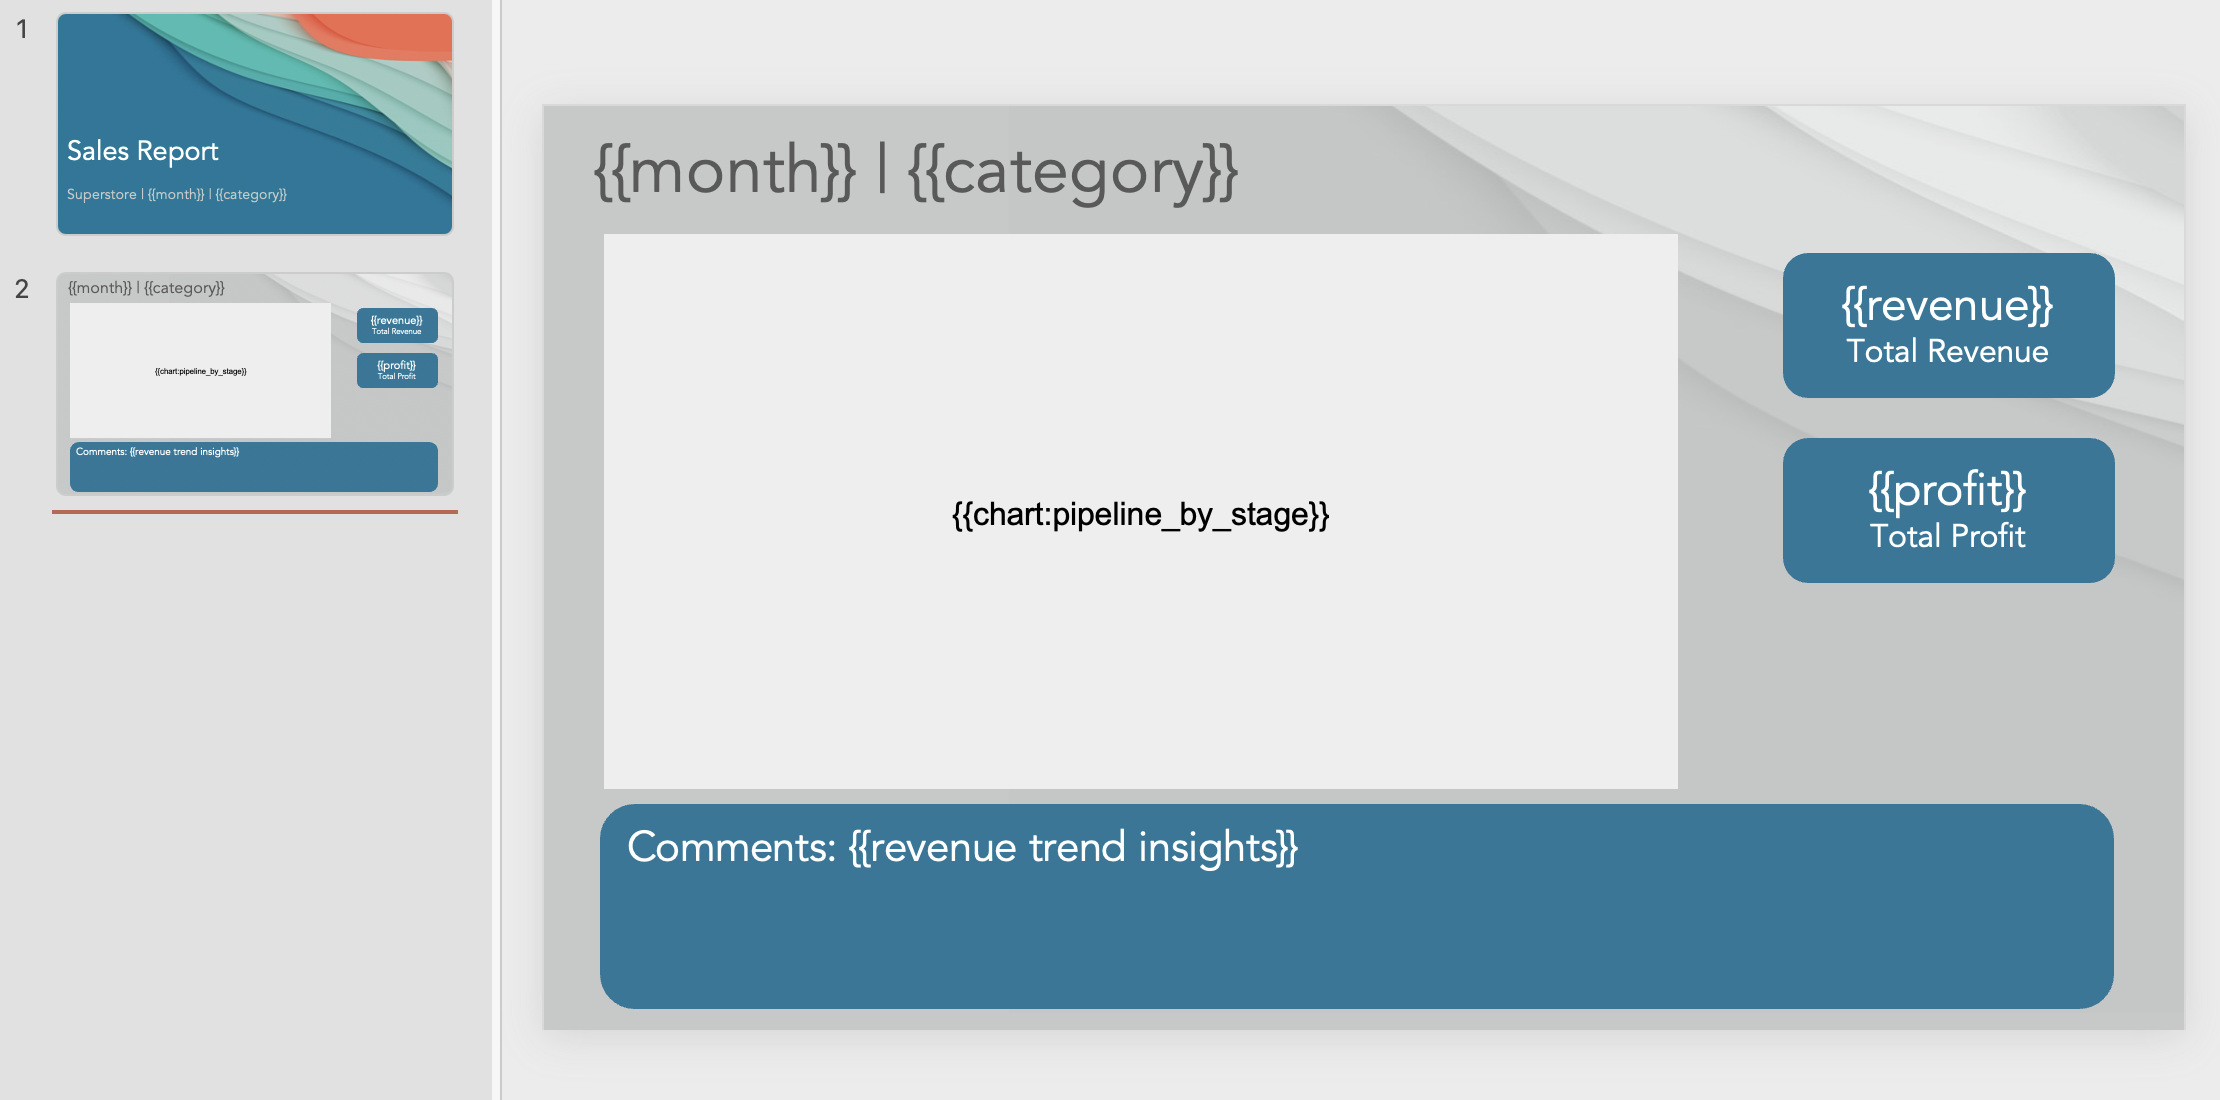
Visible placeholders on this slide:
5. Generate multiple output formats
From the same connected data and saved logic, your team can create Google Slides presentations, PowerPoint presentations, PDF reports, data-driven emails, and private dashboard pages.
6. Refresh on demand or on a schedule
Once a chart, metric, or insight is working the way you want, Slideform saves it so it can be rerun on new data later. Generate output on demand, on a recurring schedule, or in bulk for multiple clients, regions, or reps.
Why Generic AI Tools Usually Break on Recurring Reporting
Can ChatGPT or Claude automate recurring presentations from live data?
ChatGPT and Claude are excellent for writing, summarizing, and brainstorming. But they usually break down on reusable reporting templates, branded deliverables on a schedule, and scaling one report across many clients or business units.
Bottom line: generic chatbots are strong writing assistants, but they are not purpose-built for recurring reporting workflows.
Can AI presentation makers solve this?
Tools like Gamma and other AI slide generators can be useful for one-off decks from a prompt, document, or notes. Recurring reporting has different requirements: live data access, repeatable templates, branded output, refresh schedules, and multi-client scaling.
Bottom line: these tools can generate a presentation, but they do not automate the reporting workflow behind it.
Can dashboards solve the last mile on their own?
Dashboards are great for exploration and internal analytics. But client-facing and executive reporting still needs reformatted visuals, commentary, personalization, and delivery in slide decks, PDFs, or email.
Bottom line: dashboards are great for analysis. Slideform is built to turn analysis into polished deliverables.
This Is Where Slideform Comes In
Slideform combines data access, analysis, chart creation, templating, and delivery into one reporting workflow.
- Connect the data source.
- Ask the AI Analyst to create a chart, table, metric, or written insight.
- Save the output you want to reuse.
- Map it into a Google Slides, PowerPoint, email, or dashboard template.
- Generate the deliverable on demand or on a schedule.
How the Slideform Workflow Works
The Slideform AI Analyst workflow starts with the business systems your team already uses, then turns the data into reusable reporting outputs.
Step 1: Connect your data
Start by connecting the systems you already use. This could be a BI dashboard, a spreadsheet, a CRM, or a mix of sources.
- Google Sheets or Excel
- Looker Studio, Power BI, Sigma, and Tableau
- HubSpot and Salesforce
- Databases and warehouses
Step 2: Ask the AI Analyst for what you need
"Create a bar chart of monthly revenue for the past six months. Use dark blue bars, a white background, and concise month labels."
"Write a short executive summary of the biggest drivers of pipeline growth this quarter."
"List the top five accounts by expansion revenue and create a table suitable for a client QBR."
Step 3: Save the outputs you want to reuse
Instead of re-prompting from scratch each month, your team can rerun the saved logic against fresh data. That makes reporting more reliable and more scalable.
Step 4: Map the content into a template
{{client_name}}for personalized text{{chart:pipeline_by_stage}}for a custom visualization{{table:top_opportunities}}for a saved table{{executive_summary}}for written analysis
The result is a polished deliverable that keeps your brand, layout, and structure intact while the content refreshes automatically.
Step 5: Generate and deliver
From here, you can use Slideform in any of these ways depending on how you want to package and deliver the output:
- One report right now
- A fresh deck every Monday morning
- One version per client
- A completed deck plus a custom delivery email
- A private dashboard page that refreshes for internal users
Use Cases for the Slideform AI Analyst
The Slideform AI Analyst is especially strong when the same basic report needs to be created again and again with new data.
Client QBRs and EBRs
Generate one deck per client with live KPIs, account-specific charts, written insights, and branded slide templates.
Sales and RevOps reporting
Create pipeline reviews, rep scorecards, forecast updates, and opportunity summaries directly from CRM data.
Marketing performance decks
Pull from dashboards and spreadsheets, create custom visuals, and deliver polished updates to clients or leadership.
Executive summaries
Create a concise weekly or monthly view of performance with metrics, charts, and narrative in one place.
Data-driven emails
Design an email template with AI, fill it with live data, and send it automatically on a schedule.
Private internal dashboards
Turn spreadsheet or reporting data into a dashboard page for logged-in Slideform users who need quick access to refreshed KPIs and insights.
Why Teams Choose Slideform
| Capability | Generic Chatbots | AI Presentation Makers | BI Dashboards | Slideform AI Analyst |
|---|---|---|---|---|
| Connect to live business data | Limited | Limited | Yes | Yes |
| Calculate new metrics | Limited | No | Sometimes | Yes |
| Create branded charts for reports | Limited | Sometimes | Limited | Yes |
| Write report-ready insights | Yes | Sometimes | Limited | Yes |
| Fill reusable templates | No | Limited | No | Yes |
| Generate Google Slides or PowerPoint deliverables | No native recurring workflow | Sometimes | No | Yes |
| Schedule recurring output | No | Limited | Limited | Yes |
| Scale one workflow across many clients | No | Limited | Limited | Yes |
Related Guides
- Create a Presentation Template with AI for Recurring Reports
- Turn an Existing Deck into a Reusable Template with AI
- Turn a Spreadsheet into a Presentation with AI
- Turn a Dashboard into a Presentation with AI
- Generate Google Slides from Google Sheets with AI
- Generate PowerPoint from Excel with AI
- Use AI to Merge BI Dashboard Data Directly to Email
- Introducing Slideform's AI Analyst for HubSpot
- Introducing Slideform's AI Analyst for Salesforce
- Create and Update PowerPoint Presentations with AI
- Create and Update Google Slides Presentations with AI
Frequently Asked Questions
Is the Slideform AI Analyst only for presentations?
No. Presentations are a major use case, but the AI Analyst can also support email templates, written insights, charts, tables, PDF reports, and private dashboard pages inside Slideform.
Does the Slideform AI Analyst only work with dashboards?
No. It can work with dashboards, spreadsheets, CRMs, and other connected data sources. That flexibility is one reason it works well for both agencies and internal teams.
Can I use my existing deck?
Yes. You can upload an existing PowerPoint or Google Slides deck, turn it into a reusable template, add placeholders, and then refresh it with live data.
What if I need a chart that is not already on my dashboard?
That is one of the core strengths of the Slideform AI Analyst. You can ask it to create a new chart, table, metric, or summary directly from the connected data.
Can I schedule reports?
Yes. You can generate reports on demand or configure recurring schedules so they refresh automatically.
The Future of Reporting Looks Like This
We think the next generation of reporting software will feel less like exporting, copying, and formatting and more like asking for what you need, reviewing the result, and putting the whole workflow on autopilot.
That is the promise of the Slideform AI Analyst.
If your team is still spending hours every week rebuilding decks, copying charts, rewriting commentary, or sending the same update in three different formats, this is a much better way to work.
See what Slideform can do for you
Get full access to Slideform with a free trial. No credit card required.