Learn how to automatically generate slide presentations with data from Airtable. Connect your Airtable data directly to your own customized Google Slides or PowerPoint template to fill in your slide deck.
Airtable is a valuable tool for many small to mid-sized enterprises to organize, store, and automate workflows on top of their data. It offers several tools and integrations. However, many Airtable users need to create reports, often in slide decks, based on the data that they store in Airtable.
How do you get data out of Airtable and into a presentation slide?
-
You can manually copy and paste the data into the slide. This approach is definitely not ideal. It takes time and is not scalable. In addition, you will need to update the slides each time your data changes.
- You can try Airtable's Page Designer extension for Pro accounts. Having tried this, though, I can tell you that it is not particularly useful. You have to redesign your entire slide template in their system, and the output is not a Google slide or PowerPoint file. You have to print the page as a pdf.
-
You can use a specialized presentation automation tool, like Slideform, to embed the data directly into your slides. This approach leverages the Airtable API to bring data directly from your Bases into your presentations. Slideform can even combine data from multiple sources in the presentation. While it does take some initial effort to set up, the return on investment can be considerable if you create slides often and update your presentations repeatedly, or if you collaborate with a team to create slides.
Read on to see how Slideform can benefit you.
4 simple steps to link Airtable to your slides
- Create a slide template
- Add Airtable data source to Slideform
- Map the data fields
- Generate the presentation
Watch the tutorial here:
1. Create a slide template
The first step is to create a template for your presentations in either Google Slides or PowerPoint. Start with a presentation deck that you already use, so that you will maintain all the styling, layouts, and branding for your company.
My example is a template for a simple report from a vacation rental management company. It has just two slides: a title slide and a body slide with the rental performance metrics for a specific rental property.
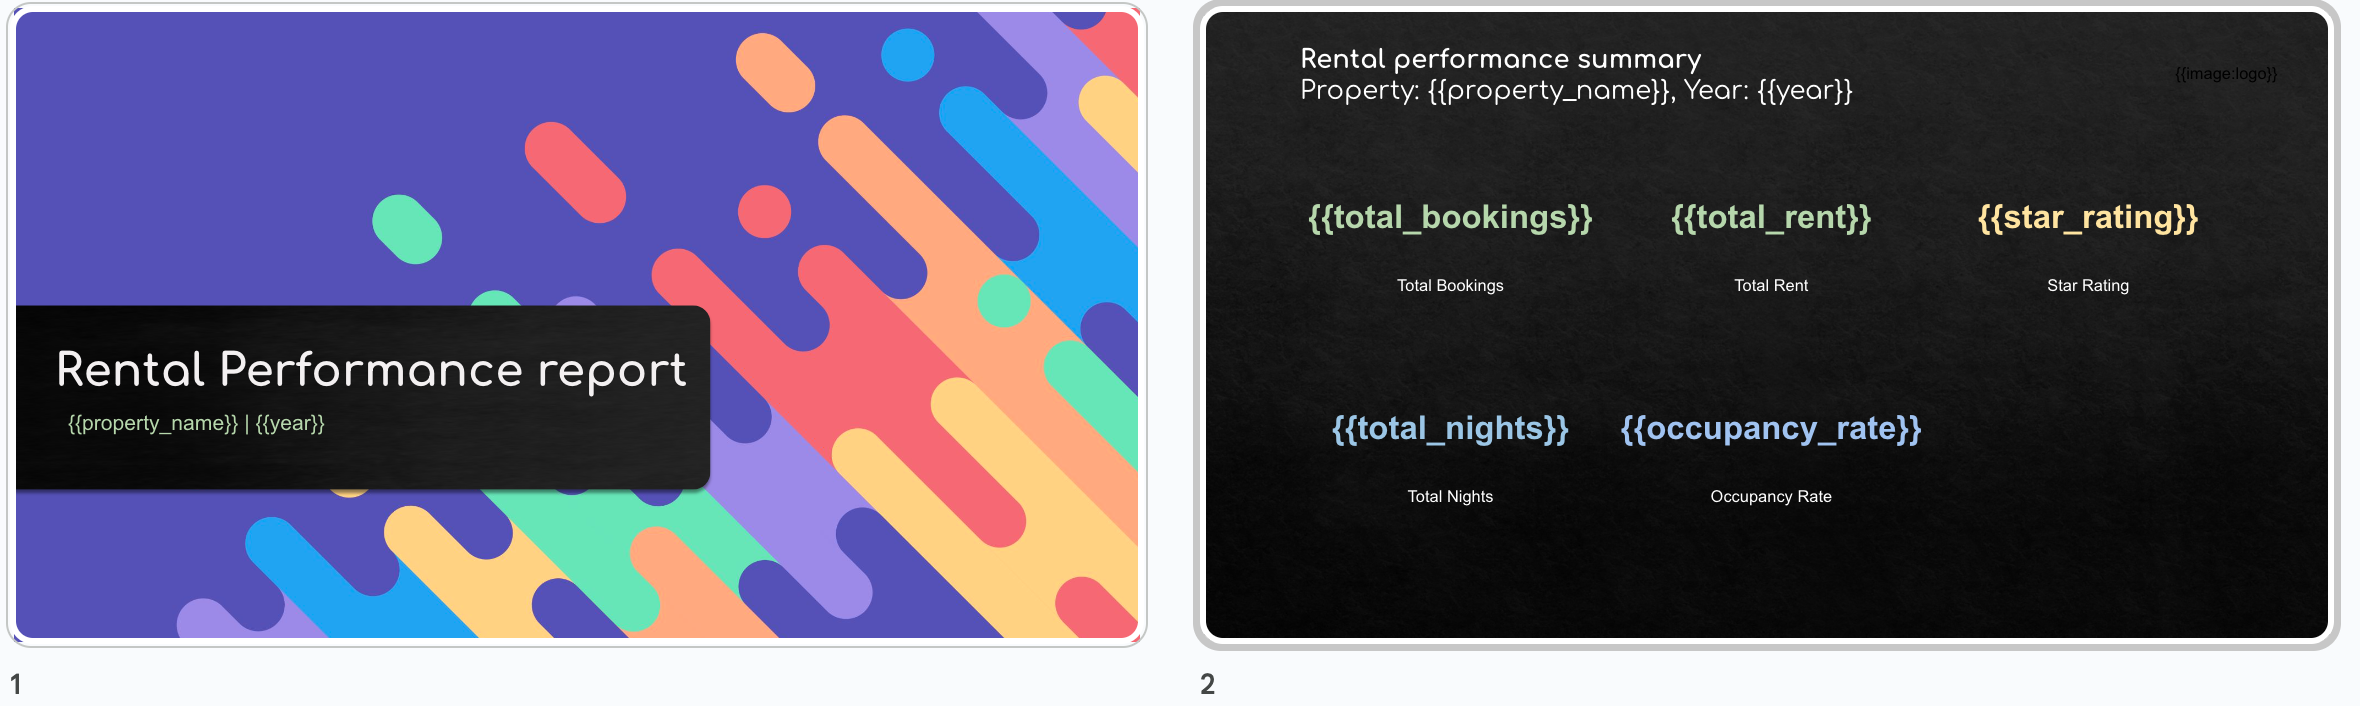
When you design your template, notice which fields you need to replace in different versions of the presentation. In my example, since it is a report on one specific property, the property name and the metrics for that property will all be unique to that specific presentation version. I can create a different presentation report for each property.
2. Add Airtable data source to Slideform
3. Map the data fields to the presentation
The final step is to link the data to your slide template. Its simple!
First, save the template in Slideform by entering the Google Slides URL or uploading a PowerPoint file. Your template will appear on your home screen as a new card. Connect your Airtable data to this project by selecting it on the Data Sources tab.
Click Configure Data to see a list of all the data placeholders, defined with {{curly braces}} , from your template. For each placeholder, select the data field that you want to fill it with. You can select the data directly or use lookups, queries, and filters to pull the data you need.
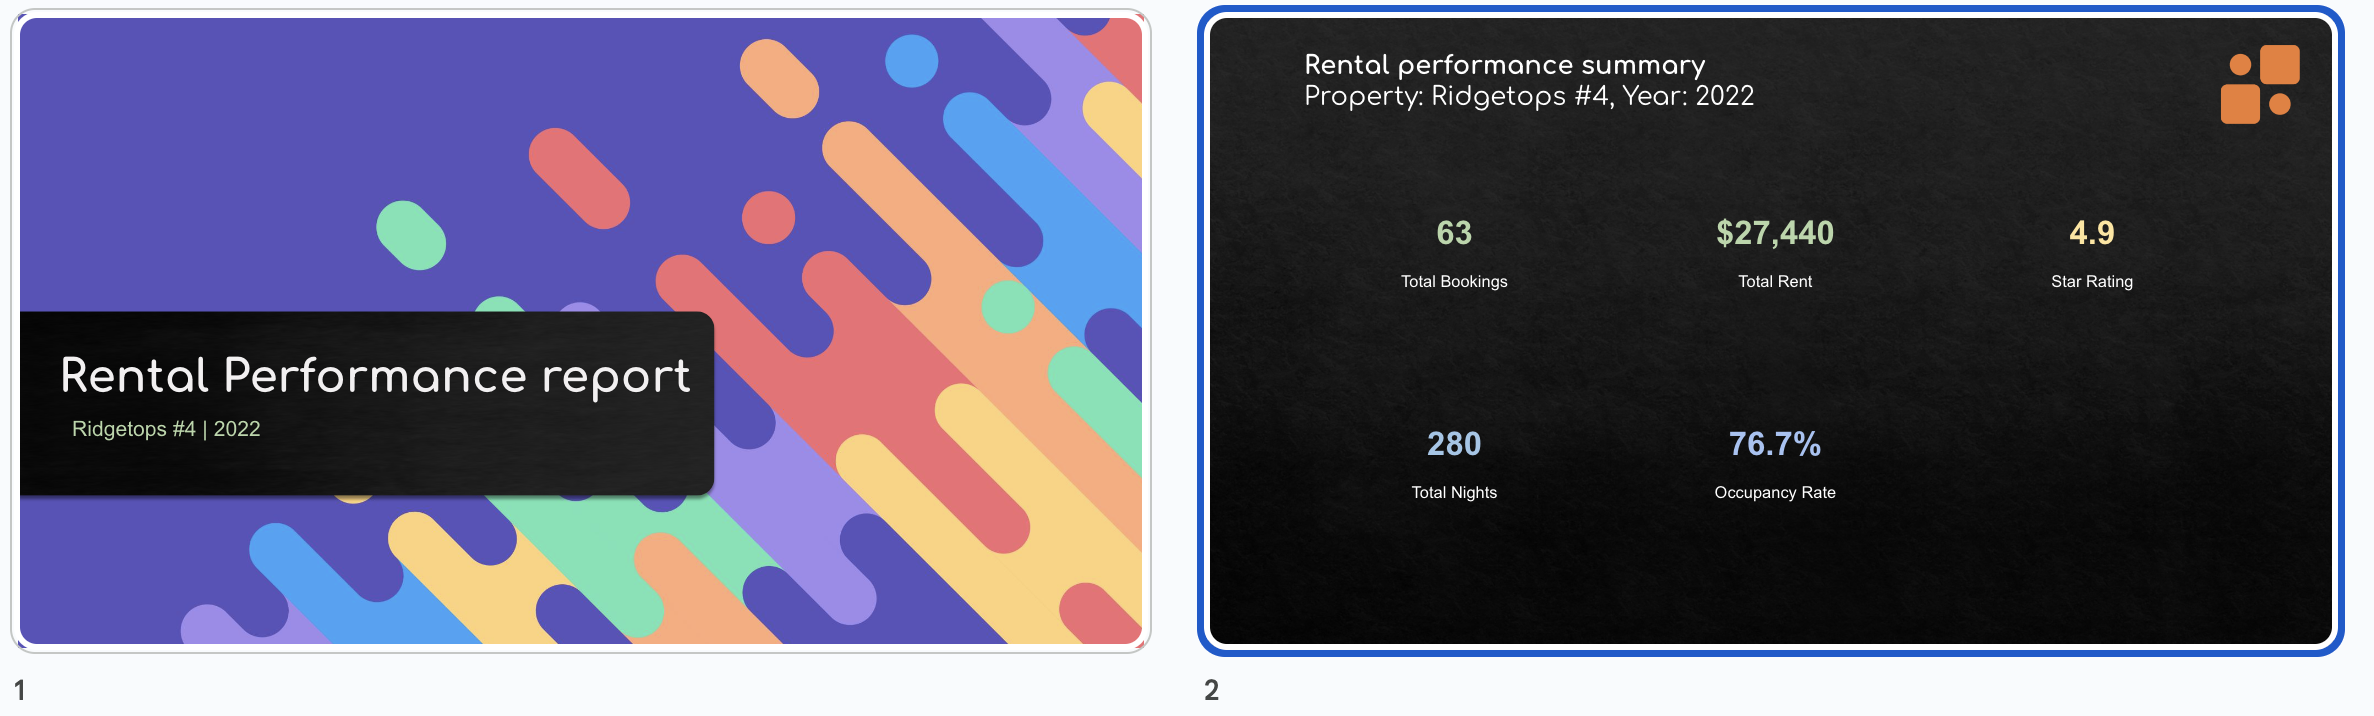
In this example, I used a lookup to select all the metrics for the property at "Ridgetops #4" and I filtered it to only the 2022 metrics.
I can also pull in charts from a Google Sheet, and images & logos from Google Drive, into the same presentation.
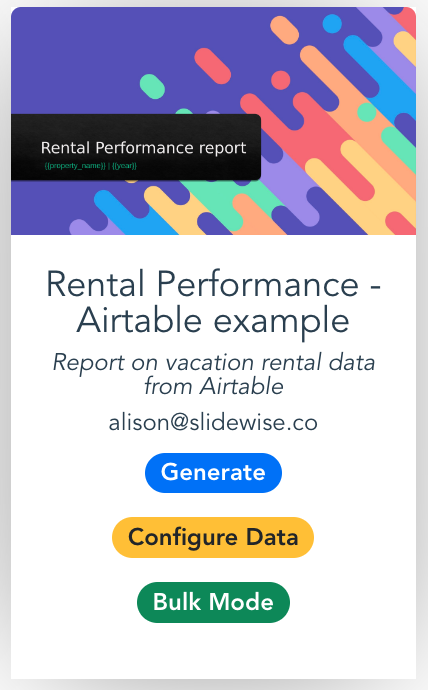
4. Generate the presentation
Now that my template and form are all set up, my team members can generate a new, up-to-date presentation whenever they need it.
Just click Generate and the data are pulled from Airtable and the other sources into a new presentation. All the formatting, fonts, text, and sizing is taken care of and the team members can download it as a pdf, PowerPoint, or Google Slides.
With Slideform's Bulk Mode, we can even can create separate, replicated presentations for each of the properties all at once, and my staff can send them out to the property owners.
Curious how much time Slideform automation can save your organization? Contact us to learn more and start a free trial!