Domo dashboards are a popular BI tool. Once you have built visualizations in Domo, you may want to insert those charts into presentations and reports. Domo does integrate with Powerpoint, but there is no great solution to export Domo charts to Google Slides. Until now!
Slideform integrates the data you need directly into your custom presentations & reports. This is especially useful for reports that you create on a recurring basis each month or week, or if you create the same report for many different clients. Let's see how to use Slideform to put your reporting on auto-pilot!
How to embed Domo cards into Google Slides
Slideform uses automation to map your Domo chart or table directly to your pre-formatted slides. You can embed multiple cards, filter the data, and combine it with other data sources as well. For a weekly or monthly report, you can generate a new presentation, with updated and accurate data, on a schedule.
-
Connect your Domo dashboard
Slideform connects to Domo via API and captures the cards, charts, and data from your dashboards for use in reports and presentations.
In Slideform, go to Data Sources > Add Data Source and click Add Integration under Domo. You or your Domo admin will need to generate an access token for your Domo account and enter it into Slideform. -
Link your Google Slides template
The slide deck template is a repeatable presentation with placeholders in curly braces. It specifies the colors, formatting, and layout that you want in each version of the presentation. This is an example template.
Each placeholder in the template will be filled with content from one of your linked Data Sources, including Domo. There are two text placeholders on slide 1; three chart placeholders on slide 2; and one chart and one data table on slide 3. Chart and table placeholders must be associated with a shape in the template to set the size and placement of the content on the slide. Read more about the slide template: How to create a slide template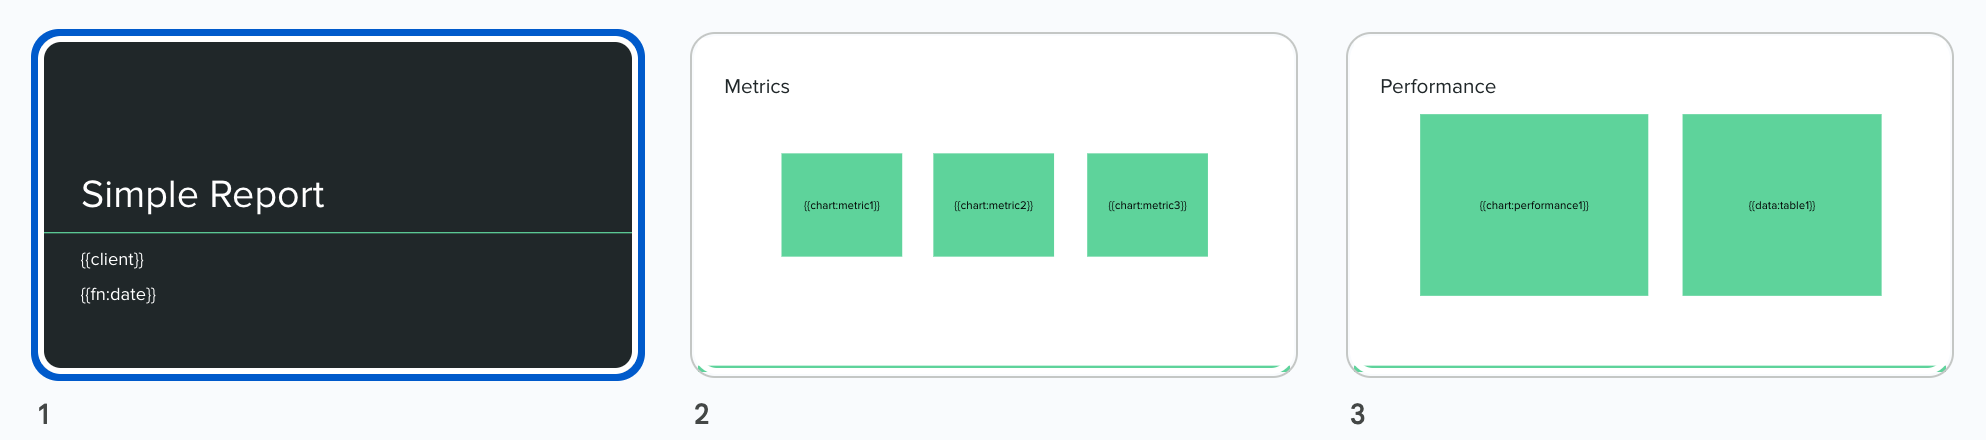
Upload your template in the New Project menu in Slideform. Authorize your Google account to access your Google Slides and select the correct presentation. -
Match data to the template
The final step is to match each placeholder in your template to the correct content from Domo and other data sources.
Click Configure Data on the project card to enter the setup screen. Make sure that the correct data sources are enabled in the Data Sources tab at the top of the page.
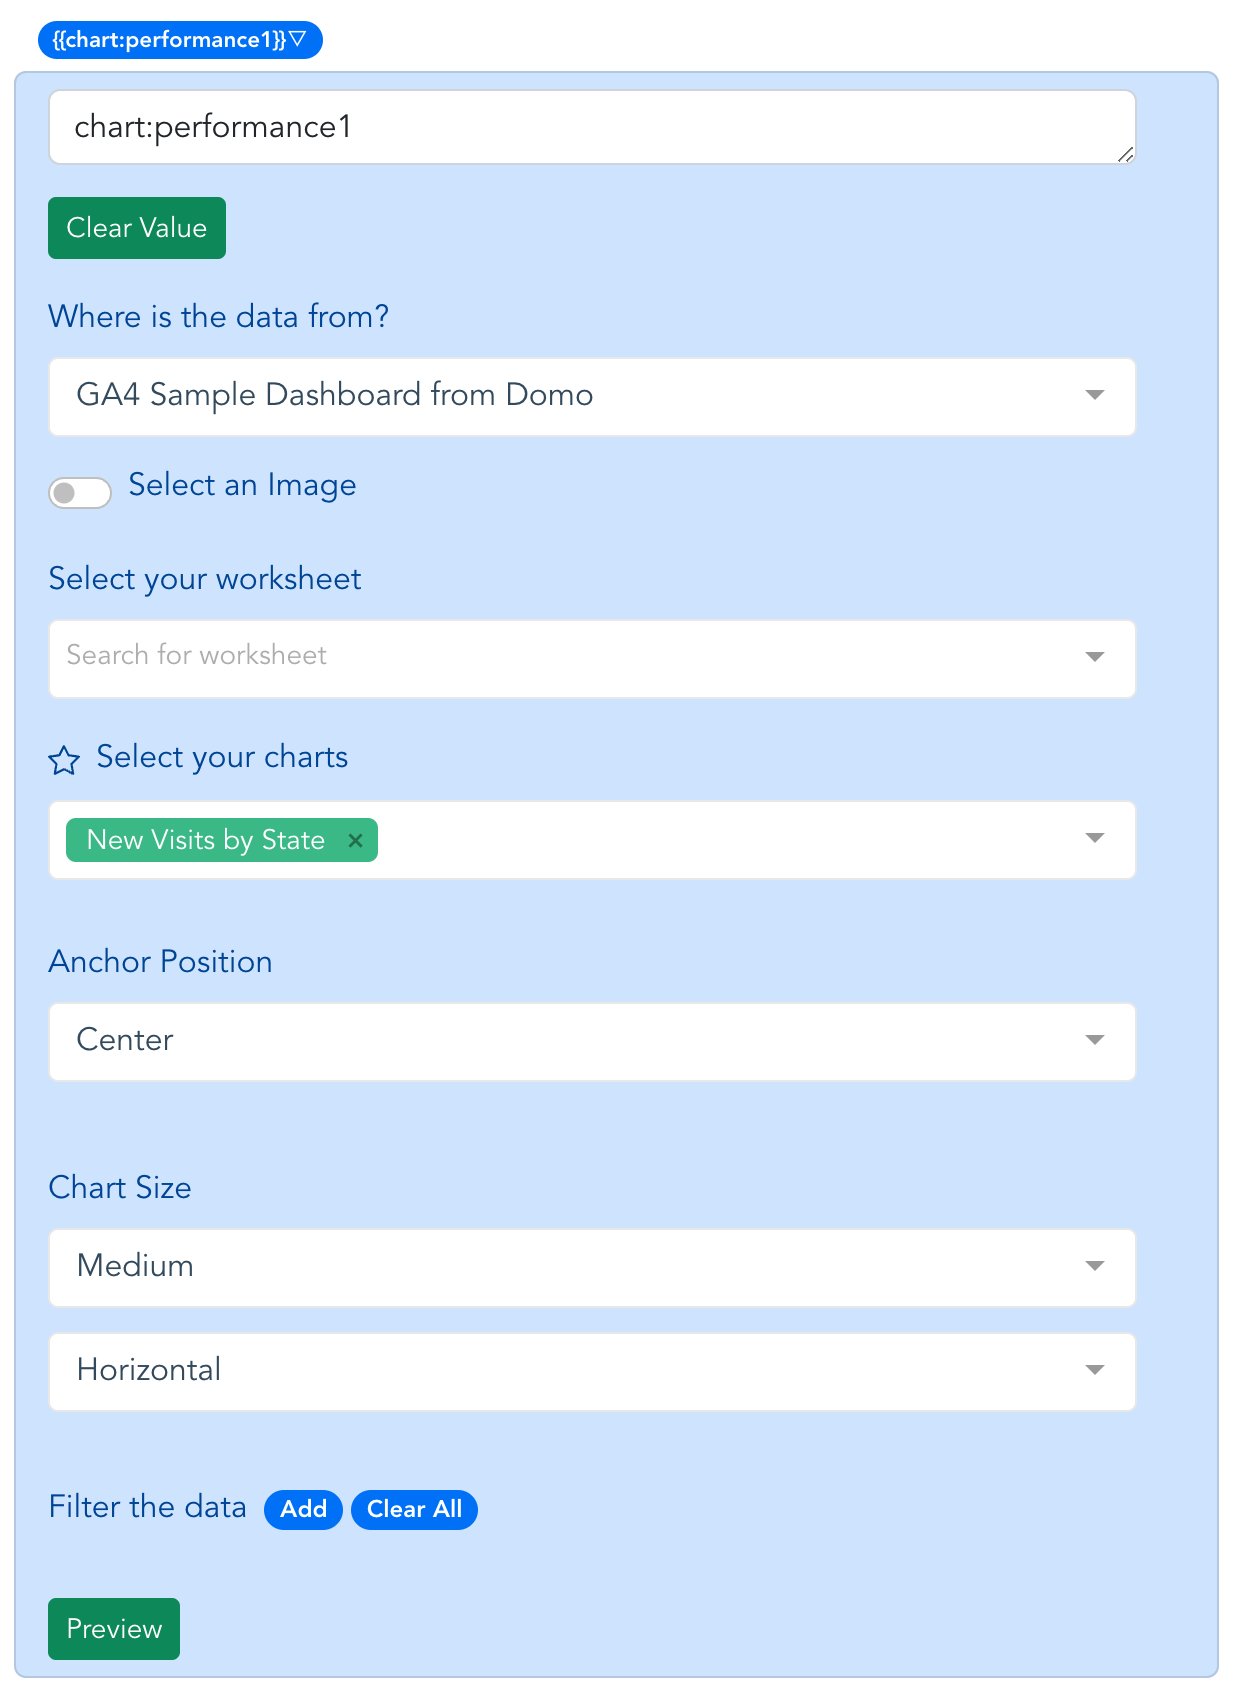
Scroll down to see each of the placeholders in your template and select Preset a Value to fill them. Then select the data source under "Where is the data from?".
Next choose the correct worksheet or dashboard page and chart from your data source. An example mapping for a chart from Domo is shown to the right. For more information about data mapping, see: How to Configure the Data Mapping
-
Generate presentations automatically on a schedule
You can generate a presentation with updated data any time you want by clicking the Generate button. Or set a schedule and have the Google Slides auto-generated and emailed to you or another recipient.
Here is an example of the Slides with content filled in from Domo: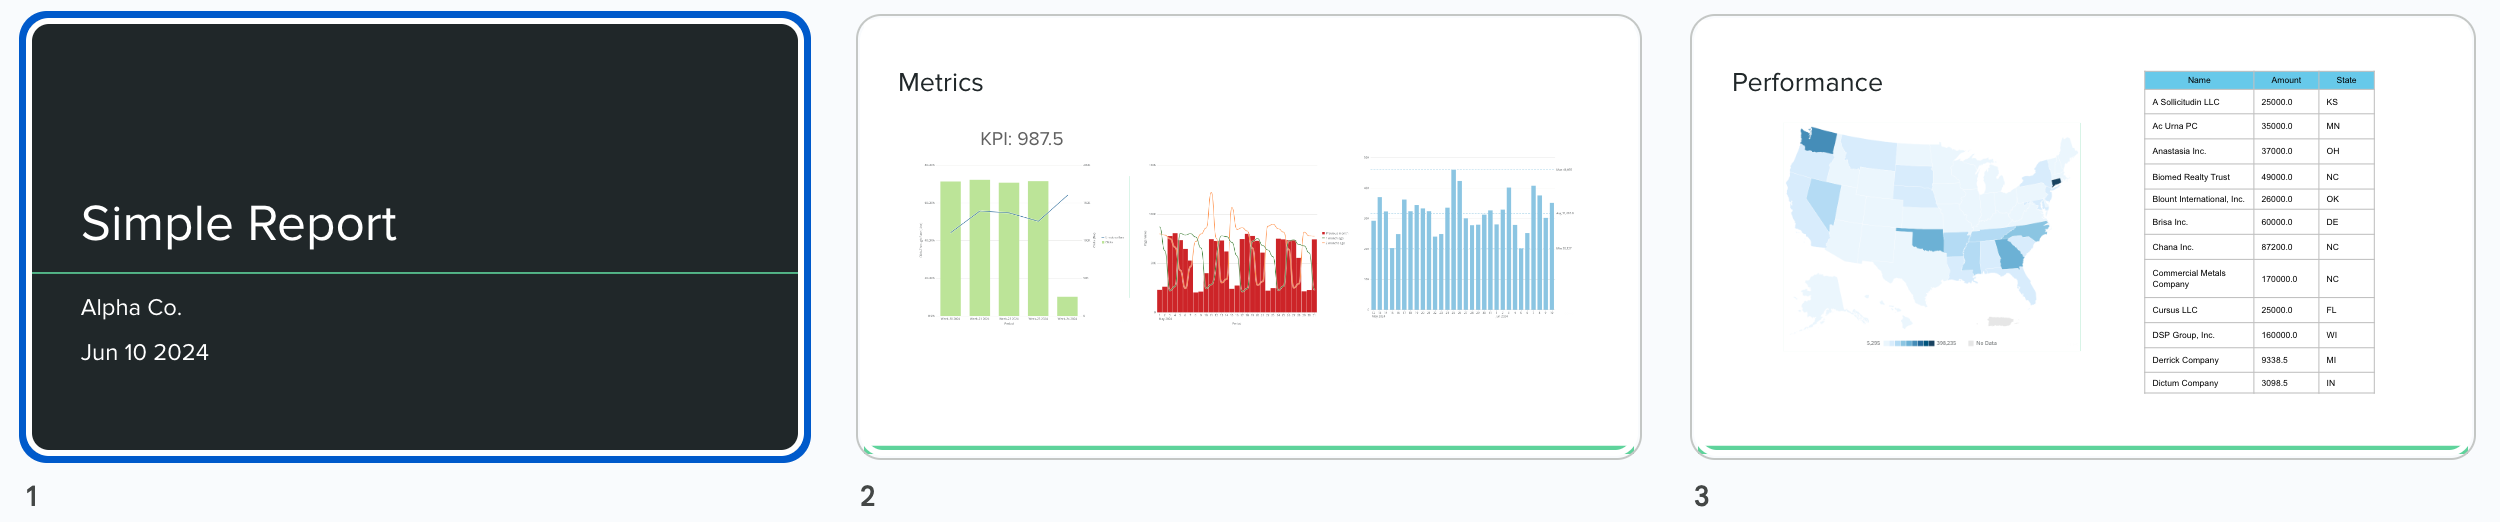
Slideform puts your reporting on auto-pilot!
- No screenshots! And no copying & pasting.
- Set recurring presentations to auto-generate on a schedule!
- Slides are viewable by all recipients; no Domo access required.
- Data (charts, graphs, numbers) automatically update when you generate a presentation.
- Combine Domo with other data sources and content including spreadsheets, images, and text.
- Use your own custom slide template in the format of your choice.
Start your free trial today!