Are you looking for a simple way to embed data from a cell in Google Sheets into a text box in...
Updated: June 19, 2025
Do you spend a lot of time creating presentations?
You may find yourself filling out the same slides over and over for different customers or for monthly or weekly reports. This is where AI can help! If you are a programmer, you could write a Google Apps script to copy the data over, but for the rest of us, there is Slideform.
With Slideform, you can now automatically generate polished and on-brand Google Slides decks from Google Sheets—and even use Slideform's AI analyst to add insights, calculate metrics, and make charts automatically.
In this tutorial, I will show you how to create Google Slides from Google Sheets with Slideform automation.
5 simple steps to automating your Google Slides with AI
Slideform's AI-powered Google Sheets to Slides Automation
1. Connect a Google Sheet with data for the presentation
Slideform integrates with your Google workspace and many other datasources. You may already have a Google Sheet with data that you need to enter into your presentation. In this example, I am creating several sales reports for different clients and I have data for each client in a Google Sheet. See one of the sheets below:
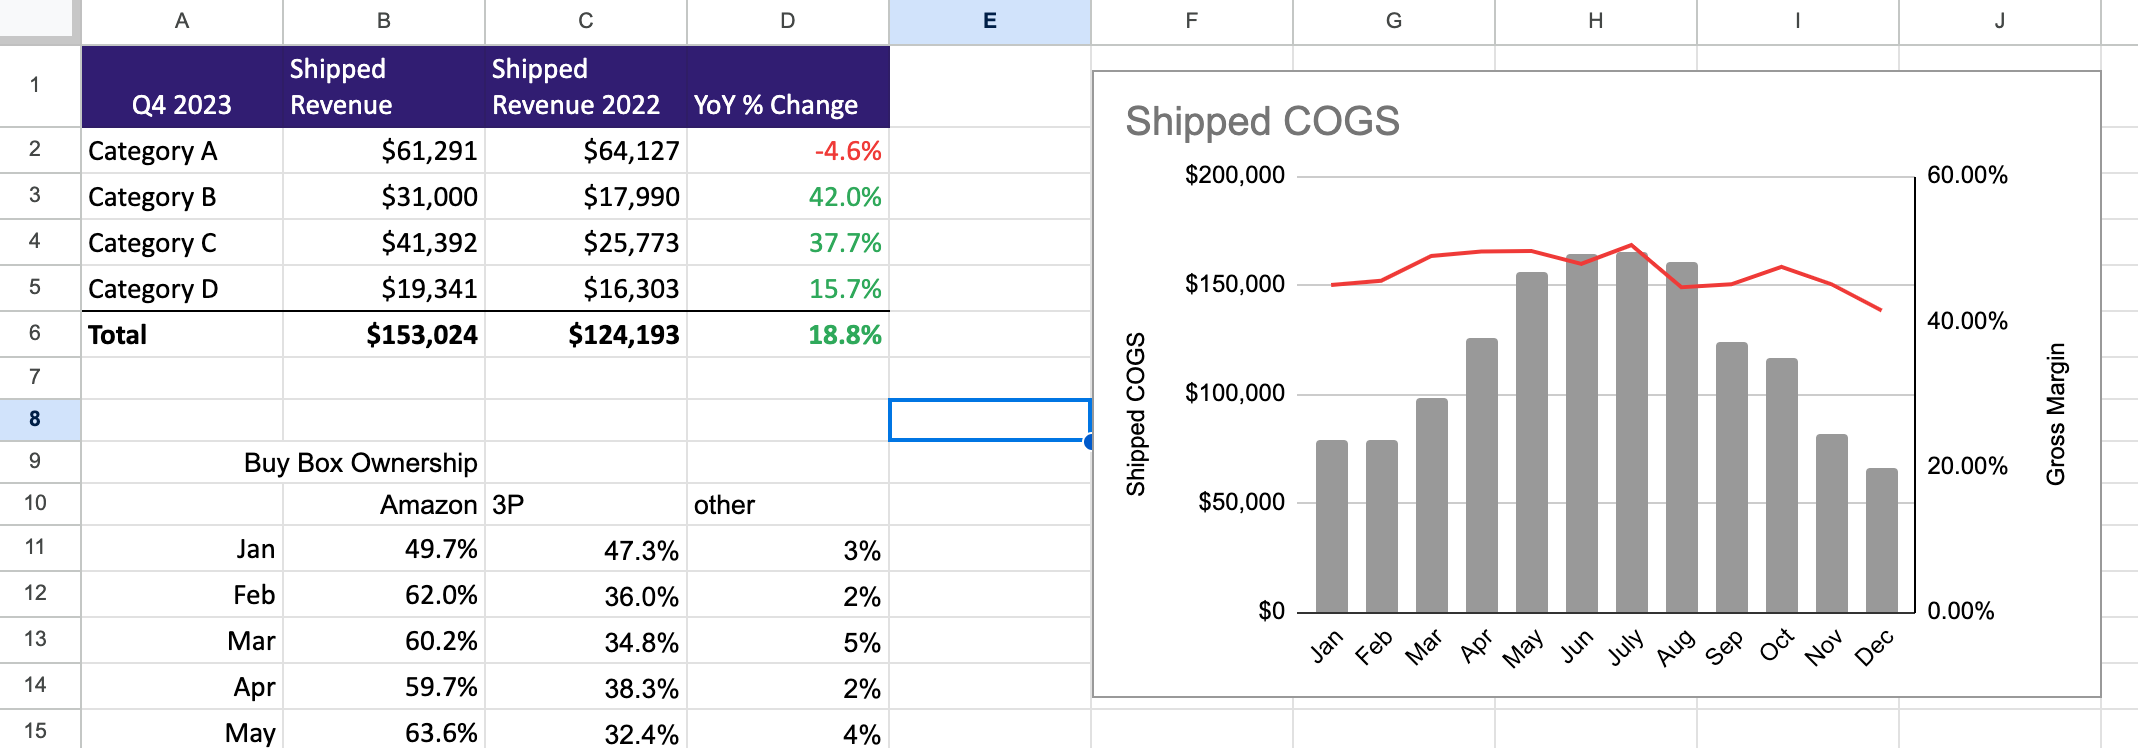
The chart and the pre-formatted table (cells A1:D6) will be used in my slides.
To connect the Google Sheet to Slideform, just authorize your Google Workspace, then add the sheet as a new Data Source.
2. Connect a custom branded Google Slides template
Next, connect a template for your presentations. Slideform can produce reports in a variety of formats, including Google Slides and PPT. You can start with a previous version of the report with structure, colors and layout that you want to see in the final output.
I created a simple sales report with two slides: a title slide and a body slide with some KPIs, data, and charts.
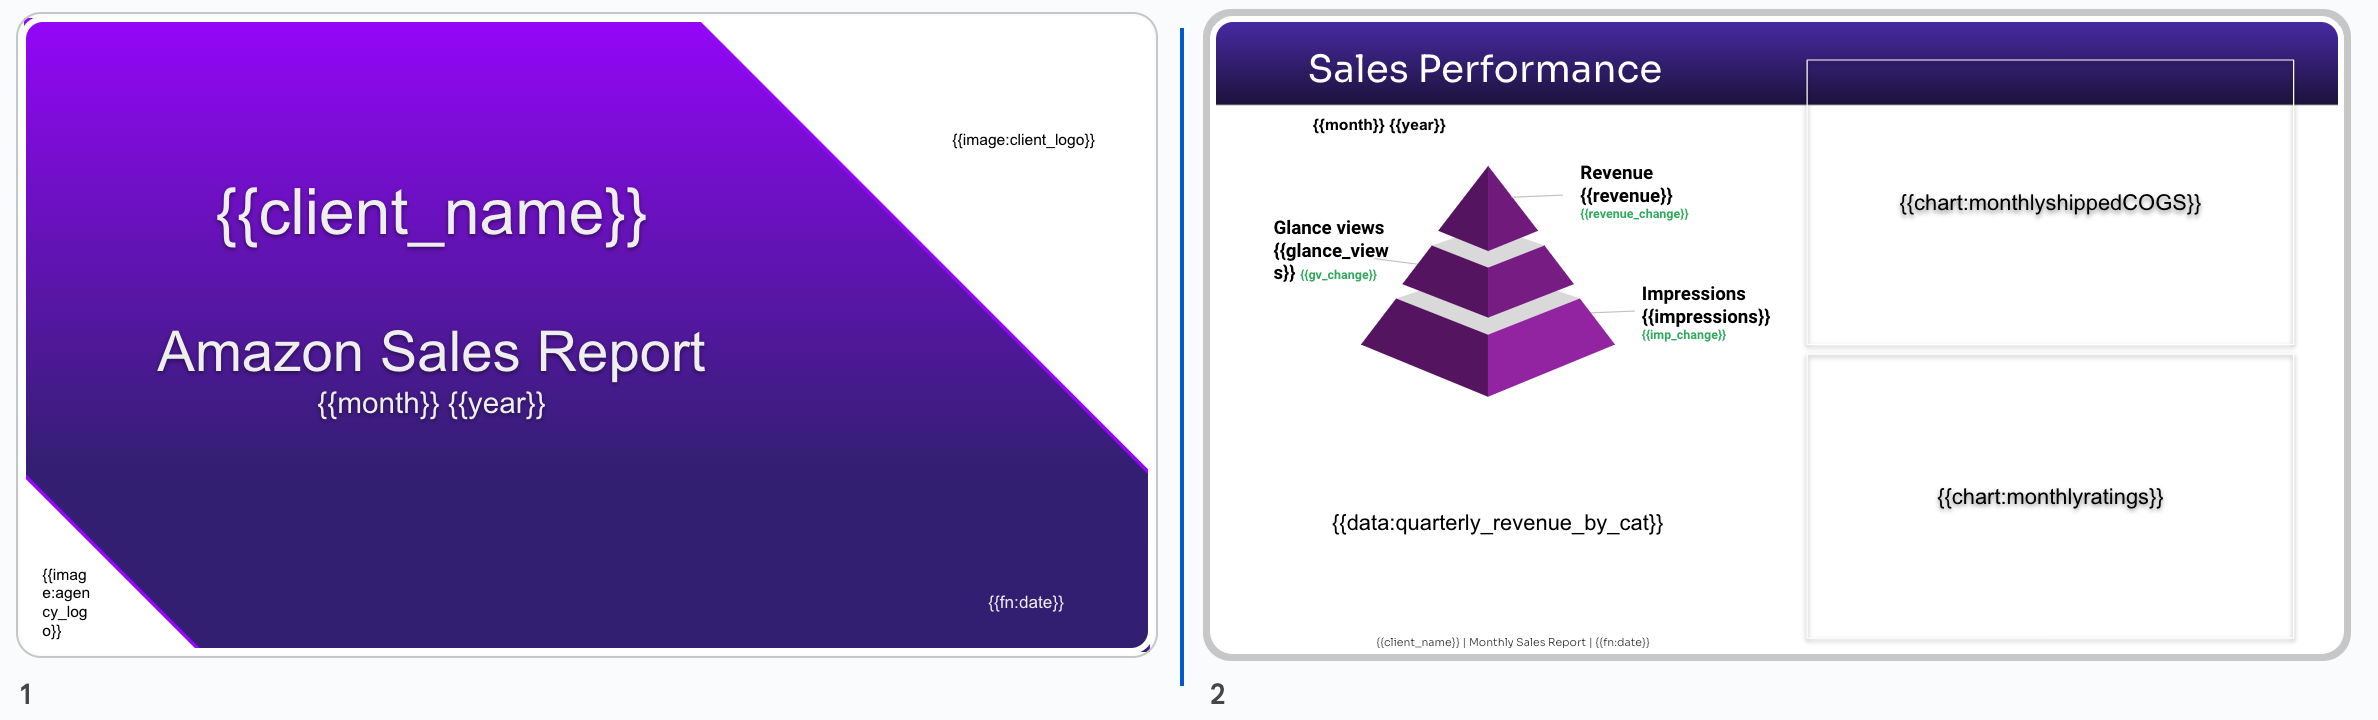
Notice the curly braces around some of the text and within the charts. The curly braces {{ and }} tell us that those elements are placeholders, called “pragmas”, and they will be replaced in the final version of the presentation.
I used many pragmas in my report template. These will all be filled in with the correct information in the final presentation. For example:
- {{client_name}} - this text field will hold the client name
- {{month}} - this will have the month name
- {{image:client_logo}} - this is an image placeholder and it will be replaced by the client logo that I have stored in Google Drive
- {{fn:date}} - the date the slides are created
- {{revenue}} - the revenue in dollars for the month
- {{data:quarterly_revenue_by_cat}} - a small table of data showing revenue by product category
- {{chart:monthlyratings}} - a chart placeholder that will be filled by a chart from my Google Sheet
Slideform can fill in images and charts (from Google Sheets and other sources) automatically. I saved all my client logos in Google Drive and linked them to Slideform, so now I can select the client and the logo will be sized and cropped into the presentation automatically!
Save the template as a Google Slides presentation in your Google Drive workspace.
3. Use AI to analyze your data
New in 2025: AI-Powered Data Analysis for Google Sheets– Slideform goes beyond simple data transfer. Use natural language prompts to tell the Slideform AI analyst what to do, then import the results into your report. This saves hours of manual analysis and aids consistency across reports.
Slideform includes all the functionality you can find in Gemini for Sheets, but goes beyond the Sheet to deliver those insights, charts, and metrics directly into your Google Slides.
Slideform's AI analyst can automatically:
-
Analyze trends in your spreadsheet data (e.g. "What was the percent change in revenue for this month compared to the prior month?")
-
Generate plain-language summaries (e.g. “What was the gross margin for 2024?”)
-
Create new native Google Slides visuals like bar charts, pie charts, and tables (e.g. "Create a chart of revenue over time")
-
Highlight anomalies or outliers in your data (e.g. "Identify any seasonal trends in the data")
This means you’re not just building a slide deck—you’re creating a recurring report with dynamic insights.
The Slideform analyst uses a proprietary process to ensure reproducibility and reliability (no hallucinations!) of the analysis from one report to the next.
4. Match data to your slide template
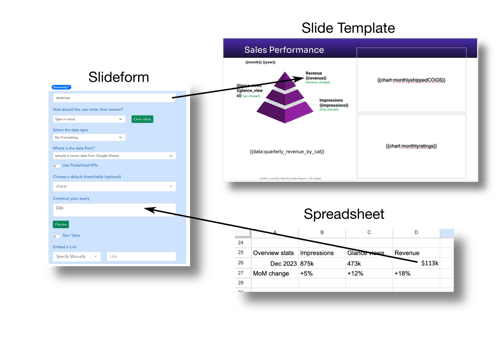
The last configuration step is to connect the data to each placeholder pragma in the template. Create a New Project and select your Google Slide template from Google Drive.

Then, specify the data source and data value to use for each placeholder.
For example for the {{revenue}} text box, I want to pull the value from a specific cell in my Google Sheet. To do this, map the {{revenue}} pragma to cell "D26" in Slideform. The dollar sign and currency formatting can either be done in the spreadsheet or you can set the formatting in Slideform.
To pull in a chart or metric from the AI analyst, first add the Analyst as a Data Source for your project, then select the metric from the list of available data.
Slideform can do complex data filtering, lookups, and dynamic formatting too! For more information see: How to Configure the Data Mapping
You can embed charts, text, images, number, percents and more from more than one data source into the same Google Slides deck. Save the data configuration once all pragmas are set.
5. Generate the presentation
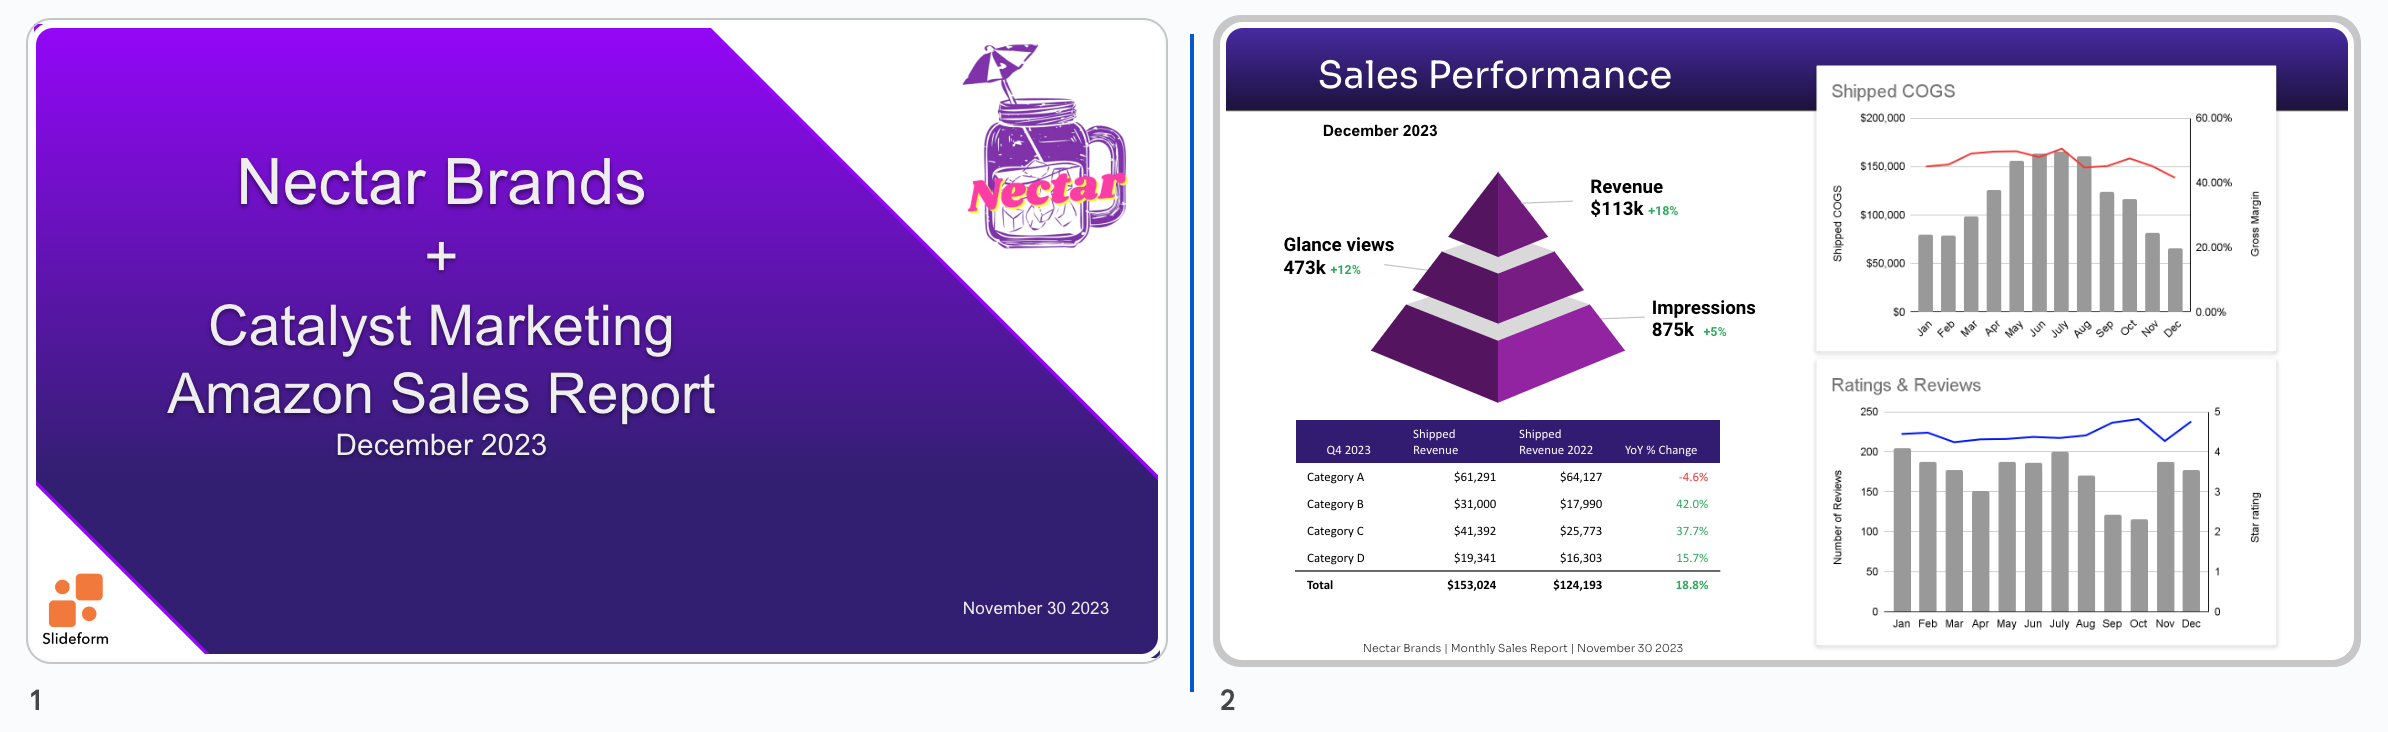
Now that my template and data are linked, I can generate the presentation whenever I need by clicking Generate.
All the formatting, fonts, text, and sizing is taken care of and I just get a clean, professional, and accurate presentation very quickly. And I can save it as Google Slides, pdf, PowerPoint, or send it to a shared Google Drive. The report is fully editable so that I can add any last-minute comments or takeaways.
Now for the fun part! Automate and schedule!
Let’s generate a presentation for each my clients. All I have to do is go to my form and click Generate. I choose the client’s name and click next and the slides are ready. No more copying and pasting!
If I have more reports to send out in the coming months, I can add those data to my sheet, go into Slideform, and generate the reports with one click. We can also schedule the reports to run automatically and send the results via email or Slack.
Want to supercharge your reporting workflows?
Try Slideform’s AI-powered Google Slides automation today. Start with a template, link your Sheet, and let our agent handle the rest—charts, text, insights, and all.