Connect your BI database directly to Google Slides
Let's face it, BI dashboards are becoming obsolete. Sophisticated businesses leveraging data warehouses are using Slideform to automatically query and pull data into presentations and reports. Reporting automation eliminates dashboards, screenshots, manual formatting, and data updates, ensuring slides and documents are always accurate, timely, and client-ready.
Slideform works seamlessly with BigQuery, Snowflake, Athena, Redshift, and PostgreSQL, making it easy to pull data from multiple sources into a slide deck. Let’s explore how Slideform automates reporting; saving valuable time while delivering high-quality reports.
What is Slideform?
Slideform is an AI-enabled automation platform that links data from databases and dashboards to reports, slides, and documents. You use your own custom report template, and Slideform fills in the data. Automation is especially useful for reports that you create on a recurring basis each month or week. Let’s see how you can put your reporting on autopilot with Slideform!
Slideform Capabilities
- Pull data from databases and other data sources into structured reports
- Automate reports in PowerPoint, Google Slides, Google Docs, and other formats
- Maintain complete control over the layout and branding of reports
- Embed visuals (like charts, tables, and scorecards) or the underlying data into reports
- Schedule reports to generate automatically with updated data
Embed SQL queries in Google Slides with Slideform
Slideform integrates with BI tools and data warehouses to automate the creation of PowerPoint and Google Slides presentations, ensuring data is always current. Here's a quick overview of how it works.
In this example, we will create a Google Slides report from a BigQuery data warehouse. The example data is a database of cocktail recipes.
1. Connect BigQuery / Snowflake / Redshift / Athena / PostgreSQL
 Set up the data integration in Slideform under "Data Sources." Click Add Data Source, and select your data warehouse provider. Enter the requested credentials.
Once the data source is connected, you will be able to query the data for embedding into reports. sheets, and slides.
Our example today uses a BigQuery table that has recipes and information about classic cocktails. Here's an example.
| Name |
Short description | Short history of the drink | Ingredients | Recipe Instructions | Complexity | Place of Origin | Primary Liquor | Flavor Profile |
| Basic Gin Highball | A light and invigorating cocktail offering a clean gin flavor enhanced by a splash of soda. Ideal for casual afternoons and relaxed gatherings. | Originated in Edinburgh, Scotland in the 1930s as a quick refreshment. | 1. Gin, 2. Soda Water, 3. Lemon Twist | Pour gin into a highball glass over ice, add soda water, stir lightly and garnish with a lemon twist. | 1 | Edinburgh, Scotland | gin | refreshing |
See Integrations for more information on connecting your data source.
2. Upload a Google Slides Deck
Next, create a report template in PowerPoint, Google Slides, or Docs. This template acts as a blueprint for your reports, defining where key metrics, data, and text will be placed. Text and numbers can be pulled into text boxes on the slides or they may be placed within the cells of a table. Data tables can be inserted into a rectangular shape on the slide.

Each dynamic element is represented by a placeholder in curly braces {{ }}. For example:
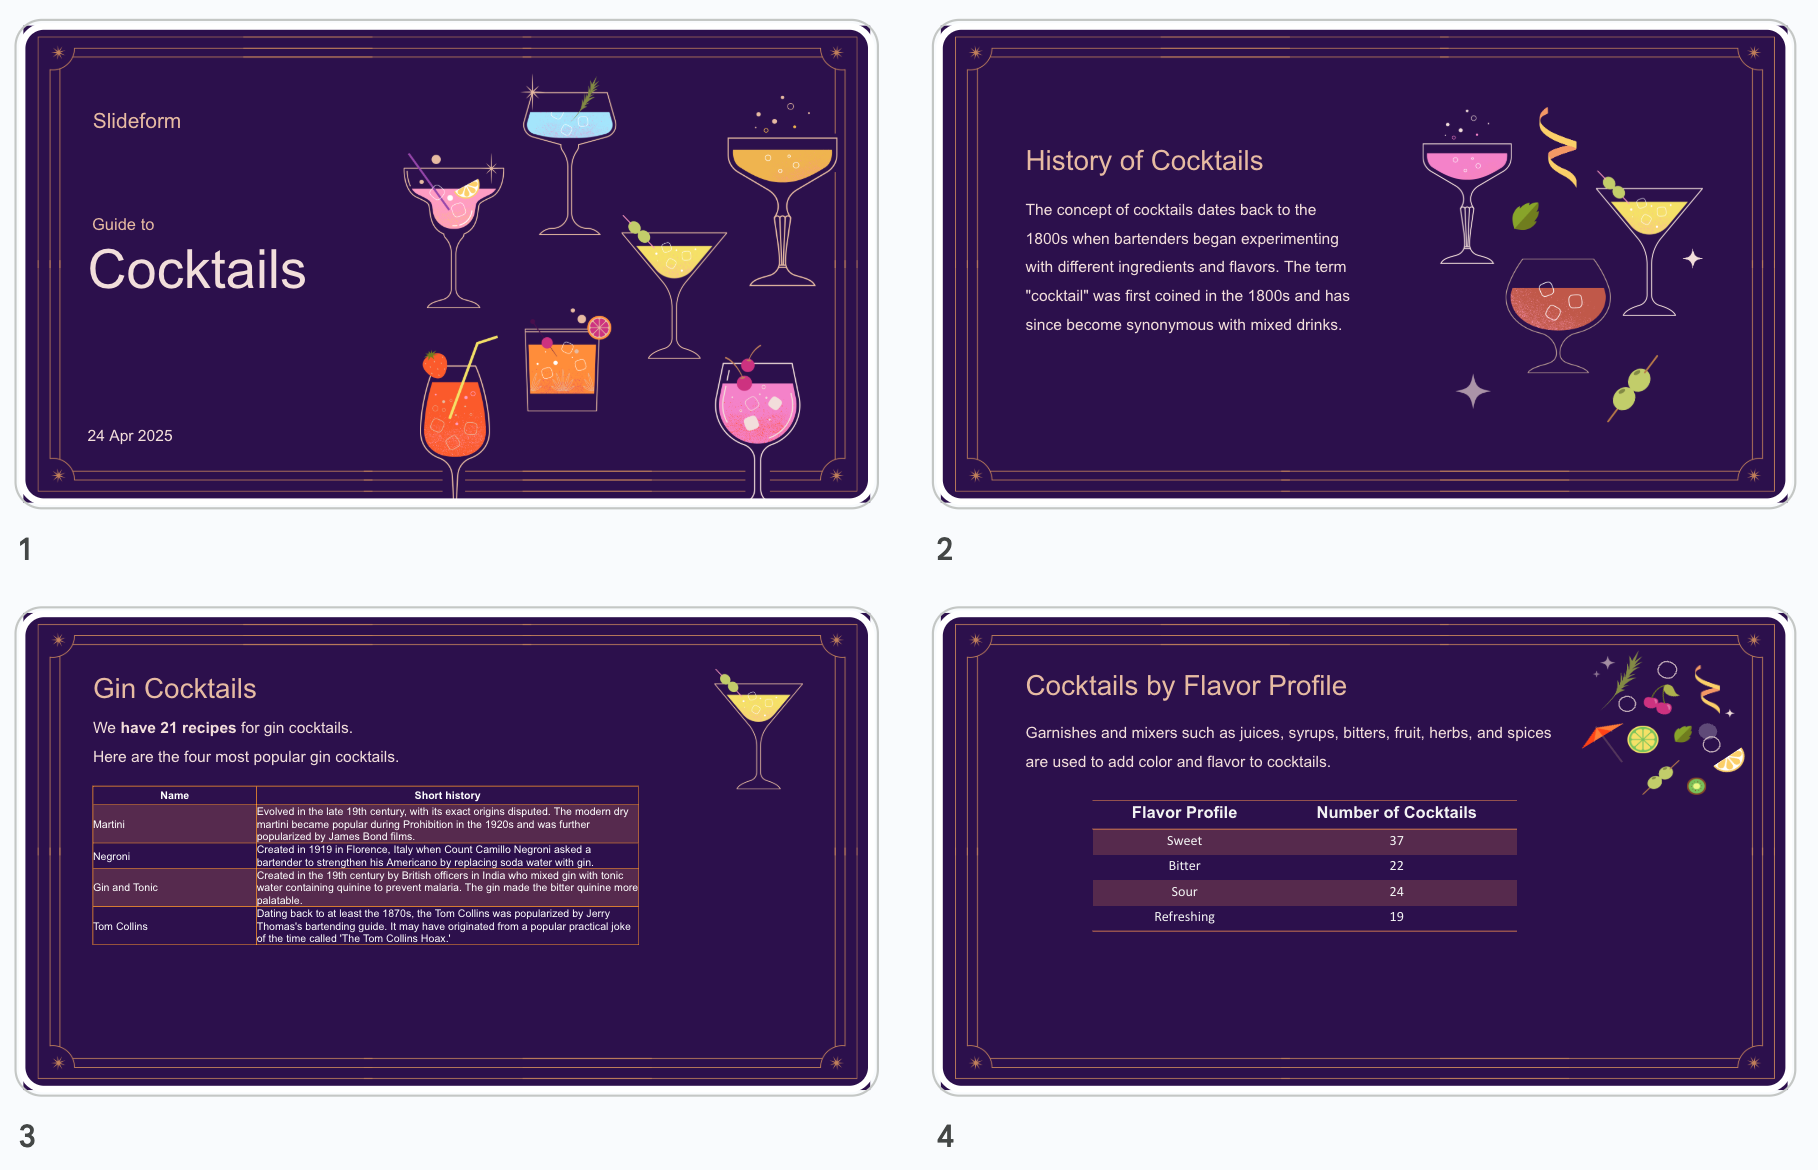
- {{gin_count}} – Count of the number of cocktails containing gin. Found on Slide 3.
- {{data:gin_recipes}} – Table of the most popular cocktails containing gin. Found on Slide 3.
- {{sweet count}} – Count of the number of cocktails with a "sweet" flavor profile. Found on Slide 4.
Set the text color, size, and style that you want to see in the template. Once your template is ready, connect it to Slideform in the "New Project" menu.
For more guidance on template creation, see Templates .
3. Link Data to the Slides
The final step is to specify the data that will fill in the report. Open your project and enter an SQL query for each placeholder in the template. Here's an example: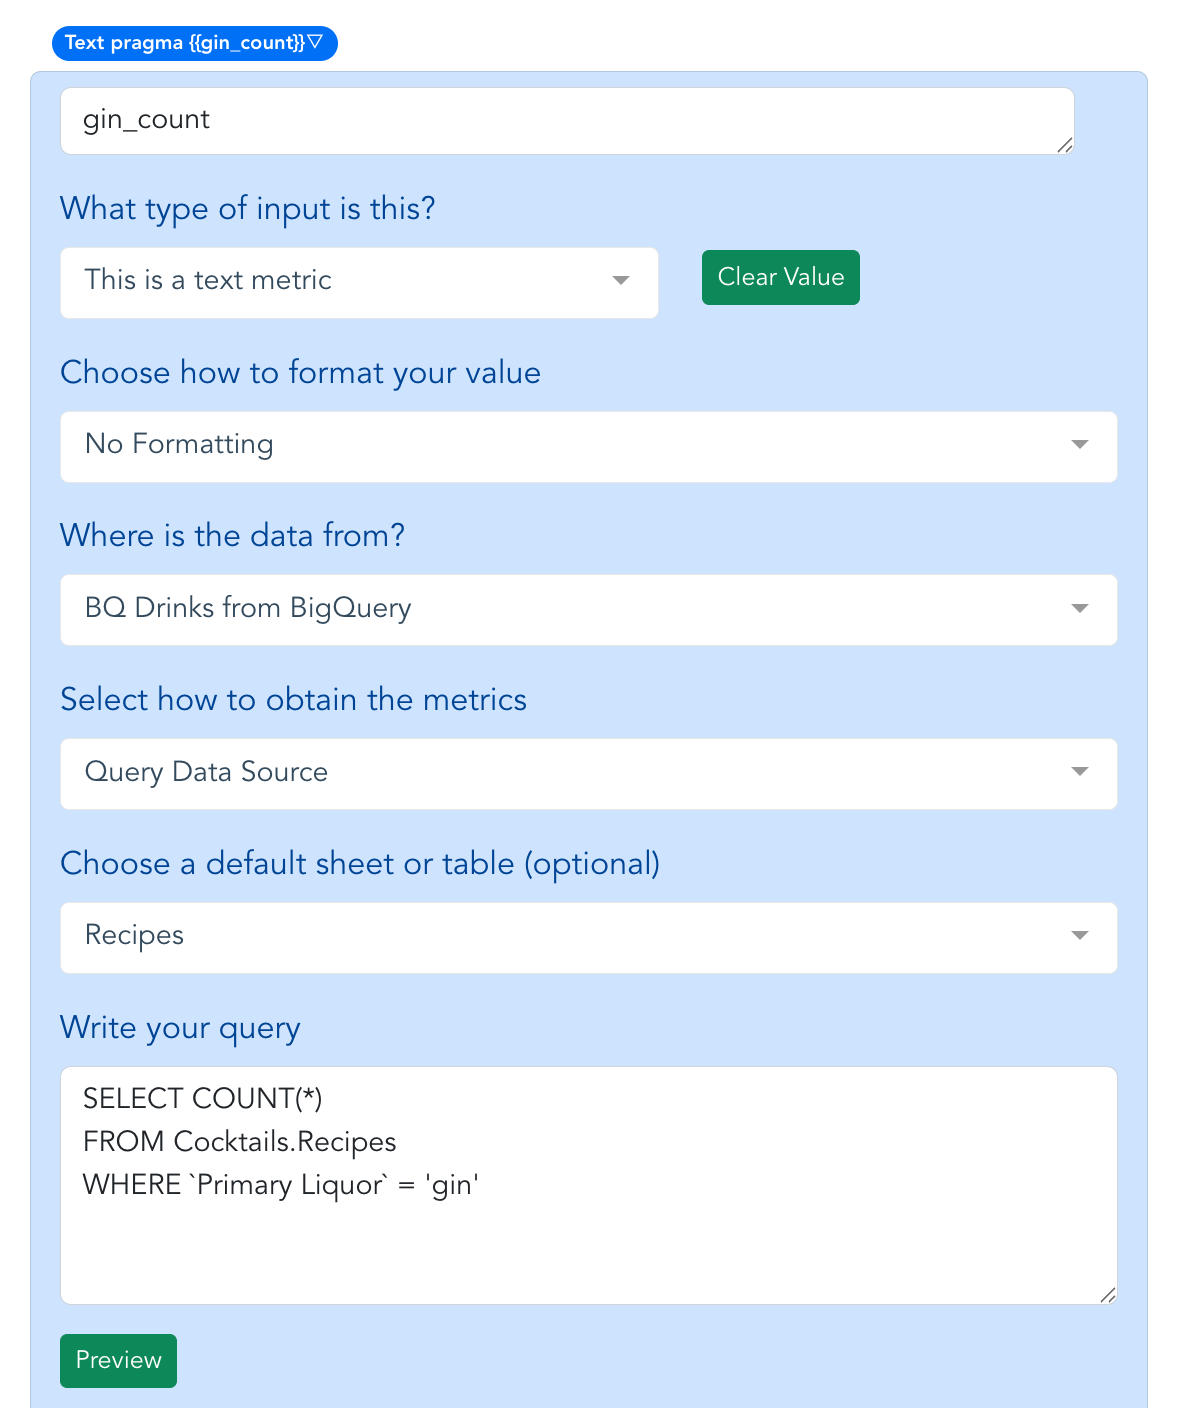
4. Generate Google Slides on Demand or on a Schedule
Now that the automation project is set up, you can start automating your reports in three ways:
- Generate a single report: Click Generate and download the report in PowerPoint, PDF, or Google Slides.
- Create multiple reports at once: Use Bulk Mode to generate a report for each campaign, client, or category.
- Schedule updates: Set up automatic report generation on a daily, weekly or monthly basis.
Slideform ensures that each report gets the latest data every time it’s generated. Slideform can also deliver reports directly to clients via email or cloud storage.
Here's the completed report with the text, numbers, and tables filled in.
Benefits of Automated Reporting with Slideform
Companies need simple, scalable reporting solutions, but dashboards often fall short. Clients and internal stakeholders prefer polished PowerPoint or Google Slides reports over navigating dashboards. Analytics teams can waste hours copying metrics, formatting charts, and updating reports instead of focusing on strategy.
With Slideform, your team can generate polished, data-driven presentations automatically. Slideform scales with the number of reports you make, and there's no limit to the number of users, data sources, or report templates you can add. You can reuse the Google Slides decks that you already have, and it's easy to make updates to the layout or content after the Slides are generated.
With Slideform, reporting doesn’t have to be a chore—automate it and focus on growing your success!