Let this be the last month that you create client reports manually! Slideform can help you save time on Google Slides and PowerPoint decks. We fill in the content on your slide template from a spreadsheet, database, or other data source.
To demonstrate how Slideform can populate Google Slides using a custom template, take a look at the monthly sales report example below. In this case, we pull data, text, KPIs and charts from several different data sources to fill in each element in the slide deck.
There are 3 elements we need to assemble to get started with Slideform.
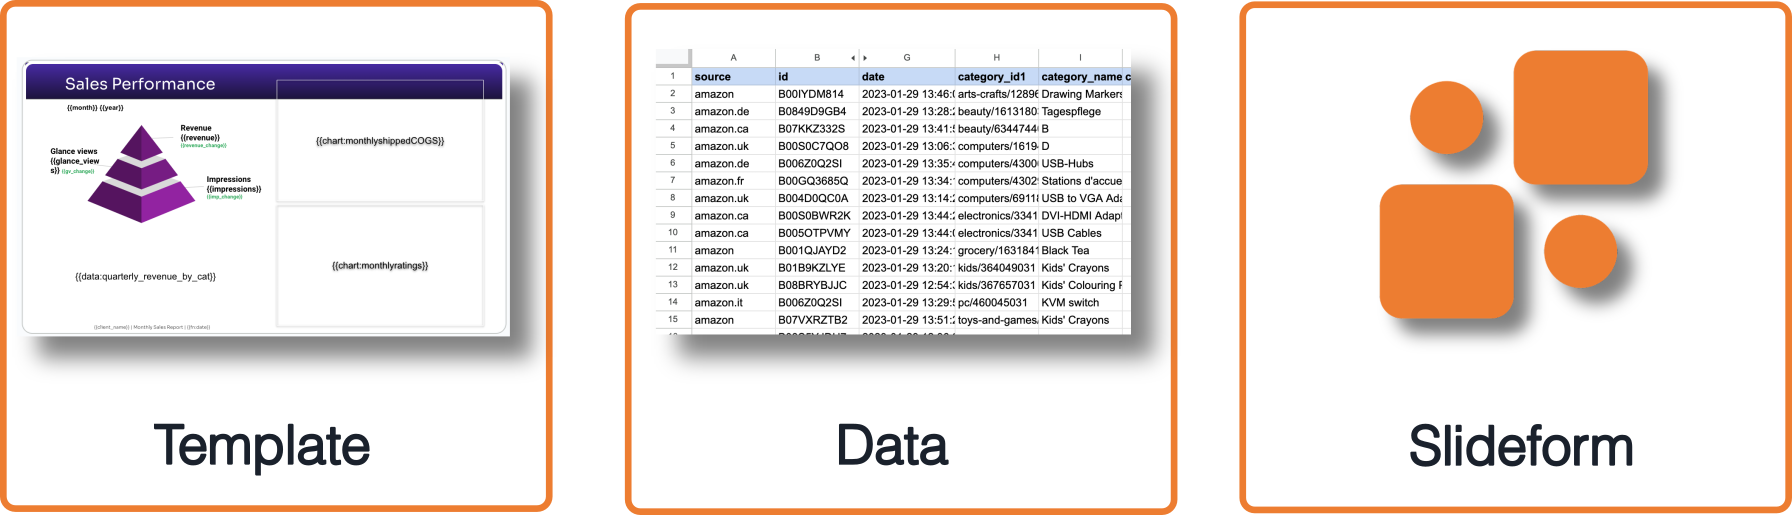
1. Use your custom report template
For my monthly Amazon sales report, I created a Google Slides presentation with all the styling, colors, and layout of the information I need in my monthly reports. This will serve as the template for the report. Alternatively, I could create the template in PowerPoint. It really depends on the format you prefer.
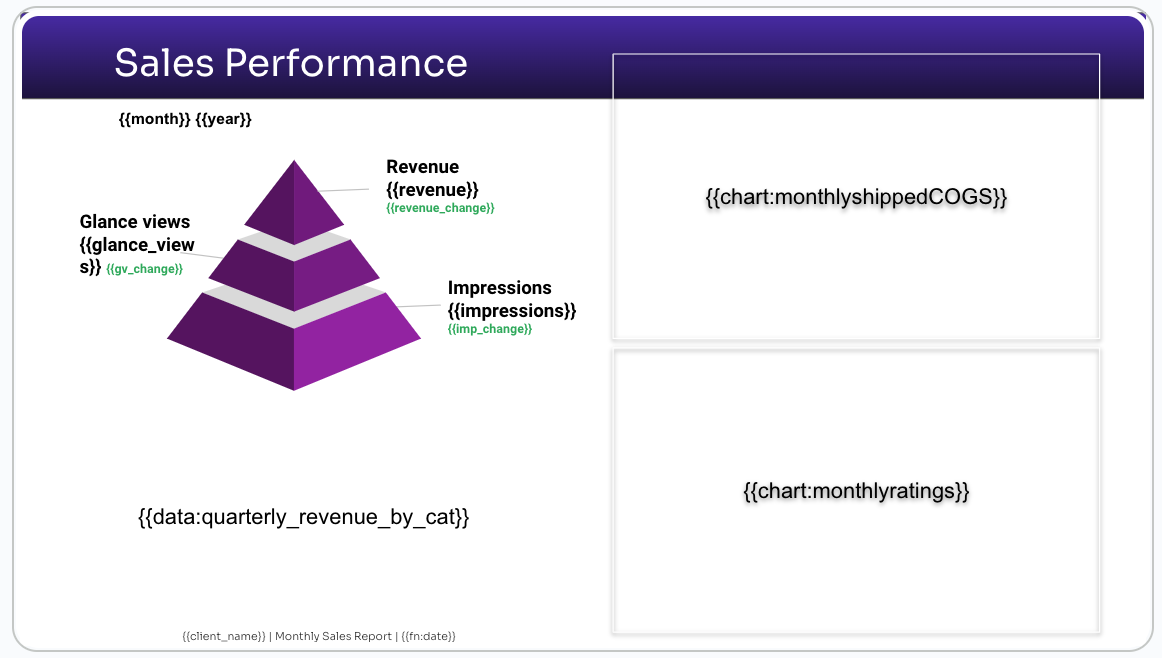
In the template, each data element is represented with a data pragma, denoted by curly braces {{ and }} . These pragmas will be replaced by the data values, charts, or other content from the data source.
For example, this slide has data elements that come from Power BI, charts from Excel, and Amazon.com sales data provided by Reason Automation. 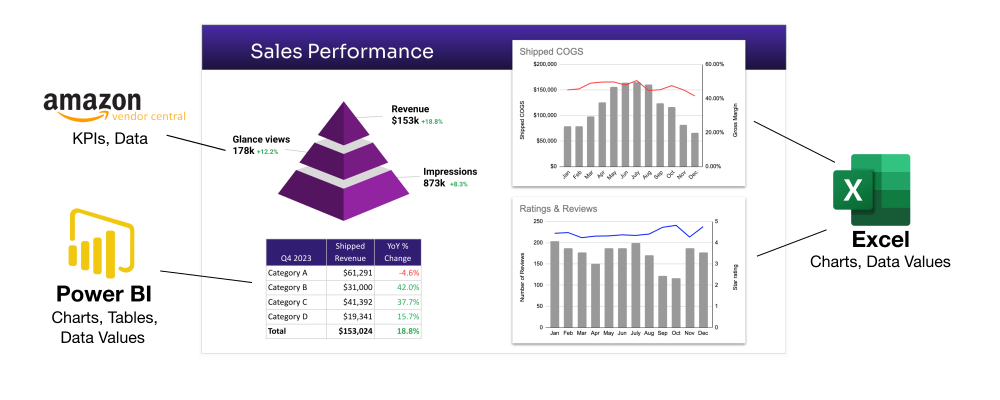
2. Connect to your data
This example sales report use three different data sources: Power BI, Reason Automation, and Excel. It is easy to combine data from multiple sources in Slideform. Check out all our supported data integrations on the Integrations page.
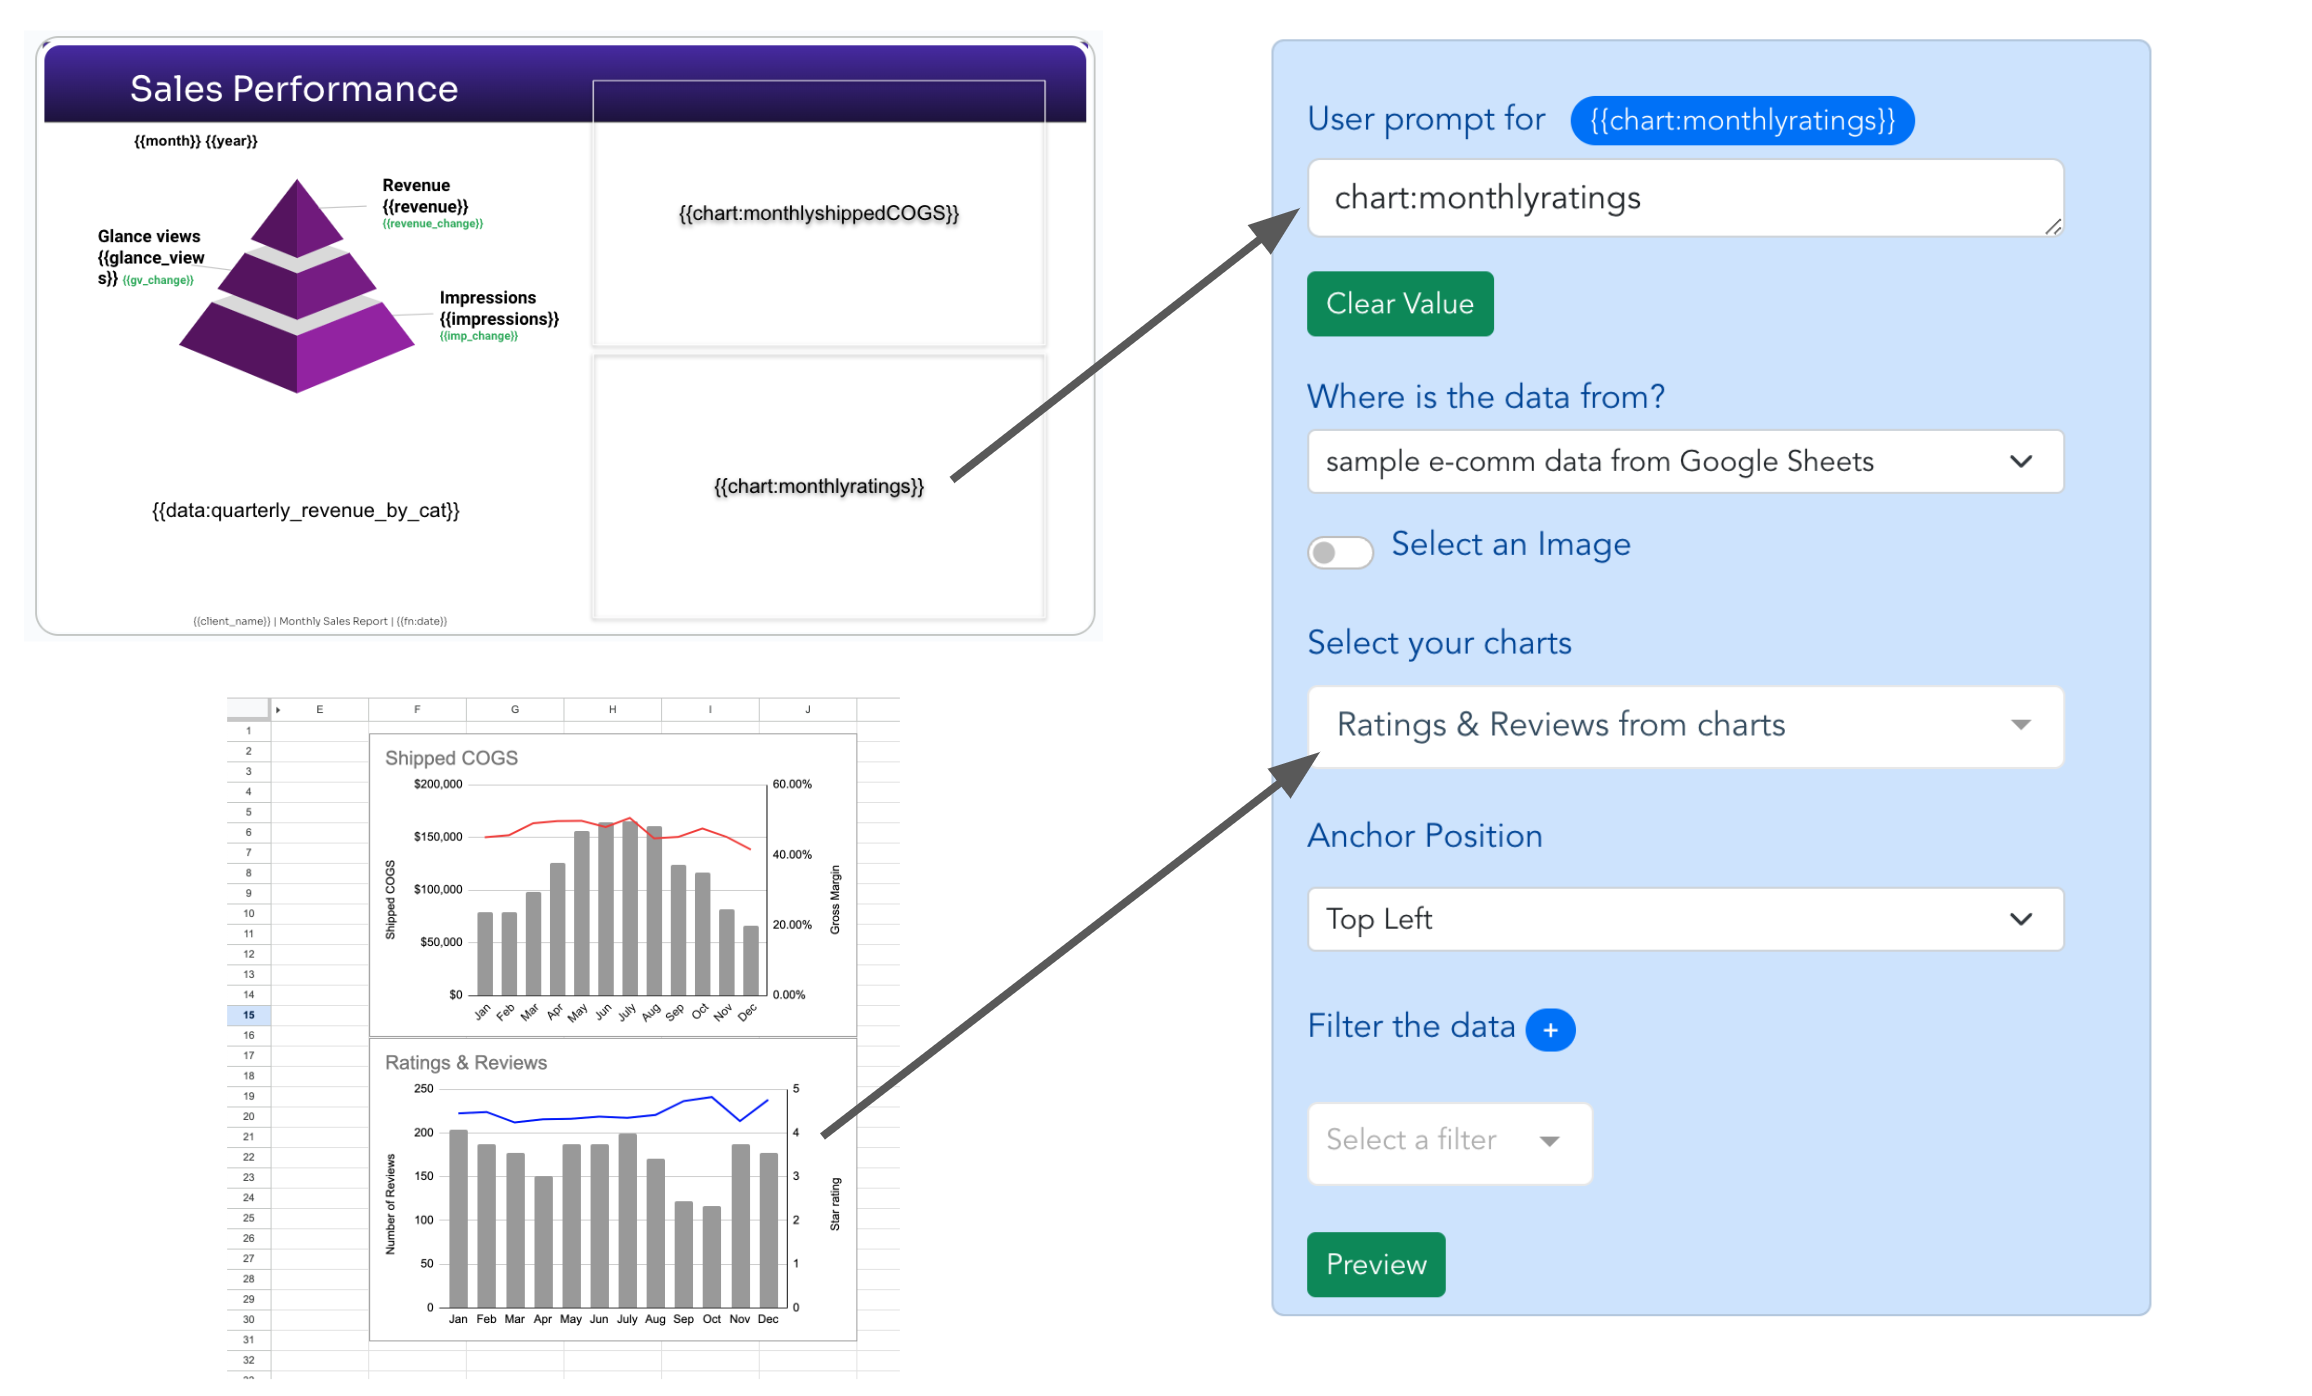
To connect a data source, just choose Add Data Source in Slideform and authenticate. Then you configure the data behind each placeholder pragma from the template.
The example below shows the placeholder for {{chart:monthlyratings}} . We first select the data source, in this case its a Google spreadsheet called "sample e-comm data". We choose the correct chart from that sheet and save the mapping. Now, this pragma will always be filled by this chart. If the chart changes next month, the updated version will be pulled in automatically!
3. Automatically populate the data in your slide deck
Now that we have connected our template and data sources, and configured each placeholder, we can generate this report anytime and have it filled in with the latest, up-to-date data. I can then save the completed report as PowerPoint file, Google Slides, or even a pdf.
Perhaps the biggest benefit is that I can replicate this same template for different clients, e-commerce retailers, or other settings. I can connect additional spreadsheets or data sources and seamlessly switch between client data sources to build custom reports from the Google Slides template. If the report needs to recur monthly or quarterly, we can also set up a schedule to auto-run the report and send it to you for review.
Contact us to start a free trial of Slideform today!