Tableau dashboards are powerful tools for data visualization and communication. However, teams that view Tableau dashboards often want access to the underlying data in order to further examine and manipulate the data in a spreadsheet. To do this, users have to manually export Tableau data into a CSV file and send it to the recipients. The process is time-consuming, laborious, and error-prone. It’s also nearly unworkable when you need to refresh the data on a regular basis. But that doesn’t have to be the case. The following guide will demonstrate the best way to connect Tableau to a spreadsheet for recurring, automated data exports.
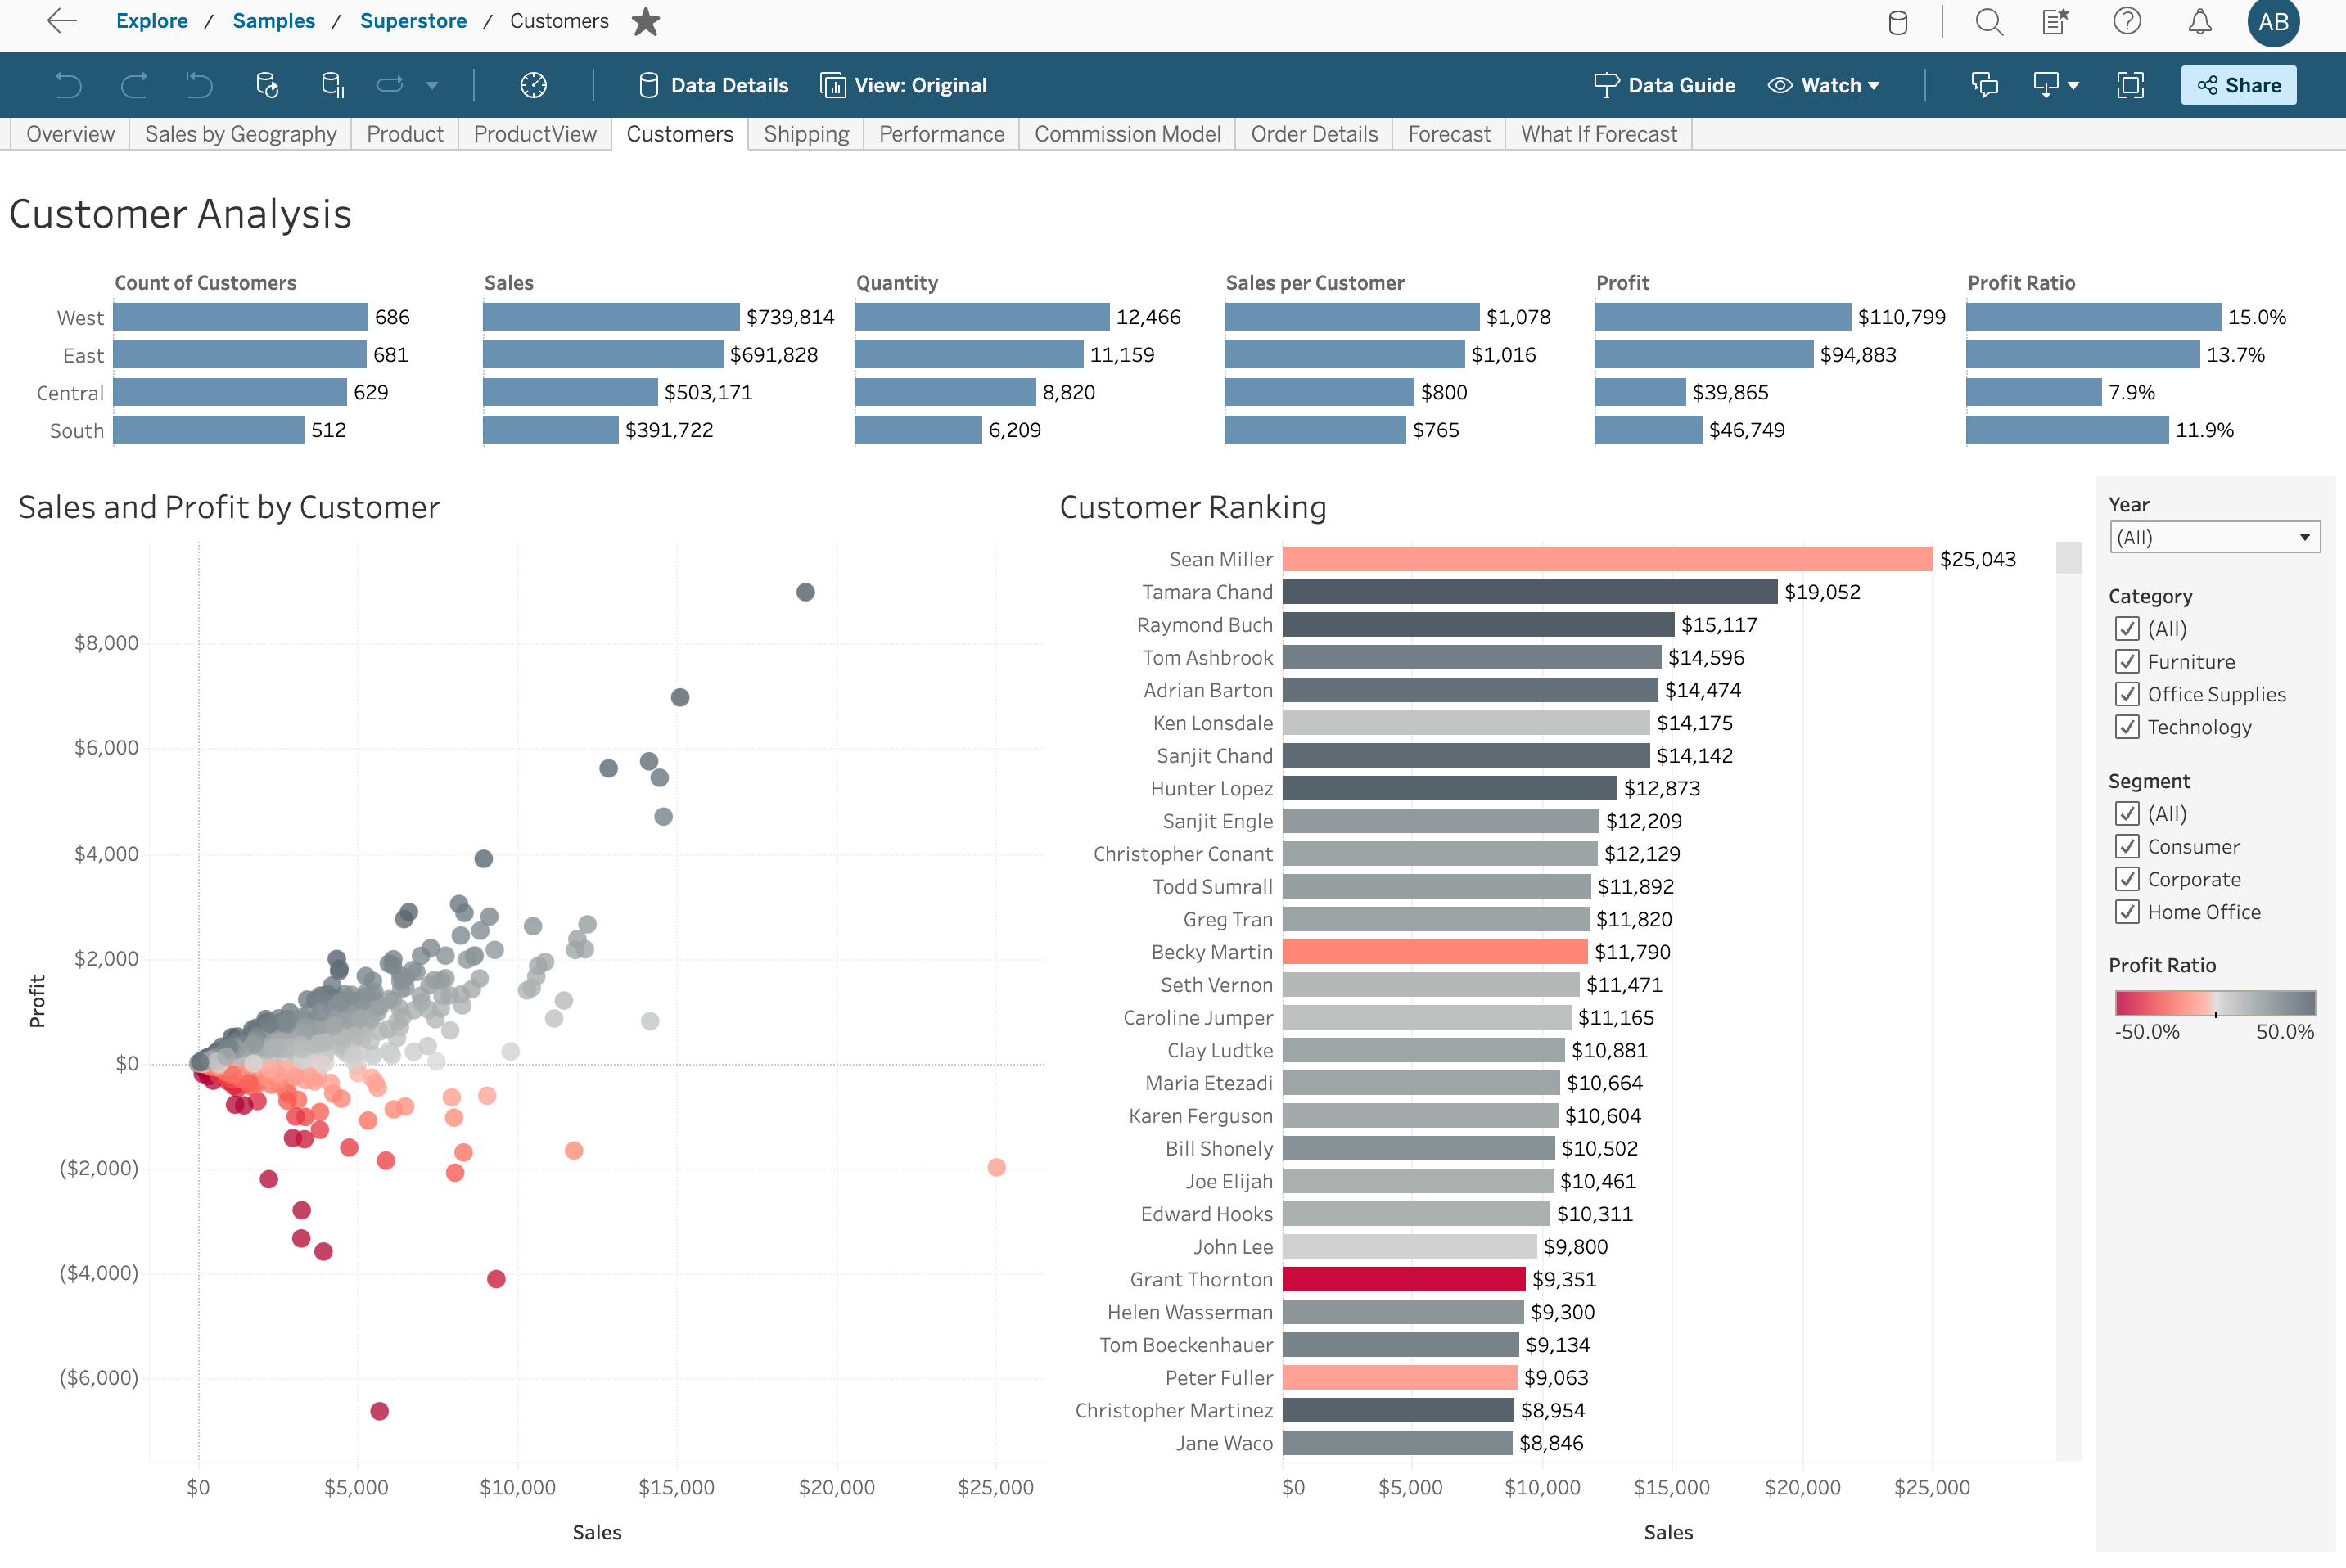
Slideform captures your entire dashboard and all elements (charts, KPIs, data tables, & filters) for use in reports, presentations, and spreadsheets.
Why Extract Data from Tableau?
Client-facing teams can enhance their analysis by leveraging Tableau data. Often, data presented in Tableau have already been cleaned and transformed by the data or analytics team, and your Tableau dashboard may present KPIs that are blended from multiple data systems. Client-facing teams can make use of this robust, enriched data in reports and custom analysis.
However, most client-facing teams do not have the experience or permissions needed to work directly in Tableau. Furthermore, the data products associated with Tableau, typically dashboards and reports, do not offer easy access to underlying data.
In order to harness the underlying data, client-facing teams often extract the data in a CSV file format. But this process is highly manual, and users often need to further filter and refine the data. This process slows down sales and reporting efforts and leads to data errors.
Client-facing teams need a way to automate Tableau data exports into spreadsheet platforms such as Google Sheets and Excel. Read on to learn how to achieve this with Slideform.
How to automatically pull Tableau data into a spreadsheet
- Connect your Tableau dashboard
- Create a spreadsheet to receive the data
- Match data to placeholders in the sheet
- Schedule the automation
1. Connect your Tableau dashboard
First, create a new connected app in Tableau, then, in Slideform, add the Tableau data source and provide the requested credentials. For more details on setup, see How to Connect A Data Source.
Slideform extracts the data behind each of the visuals in the worksheet, including charts, tables, and metrics, and makes it available to embed into your spreadsheet. Slideform also captures an image of each visual.
2. Create a spreadsheet template
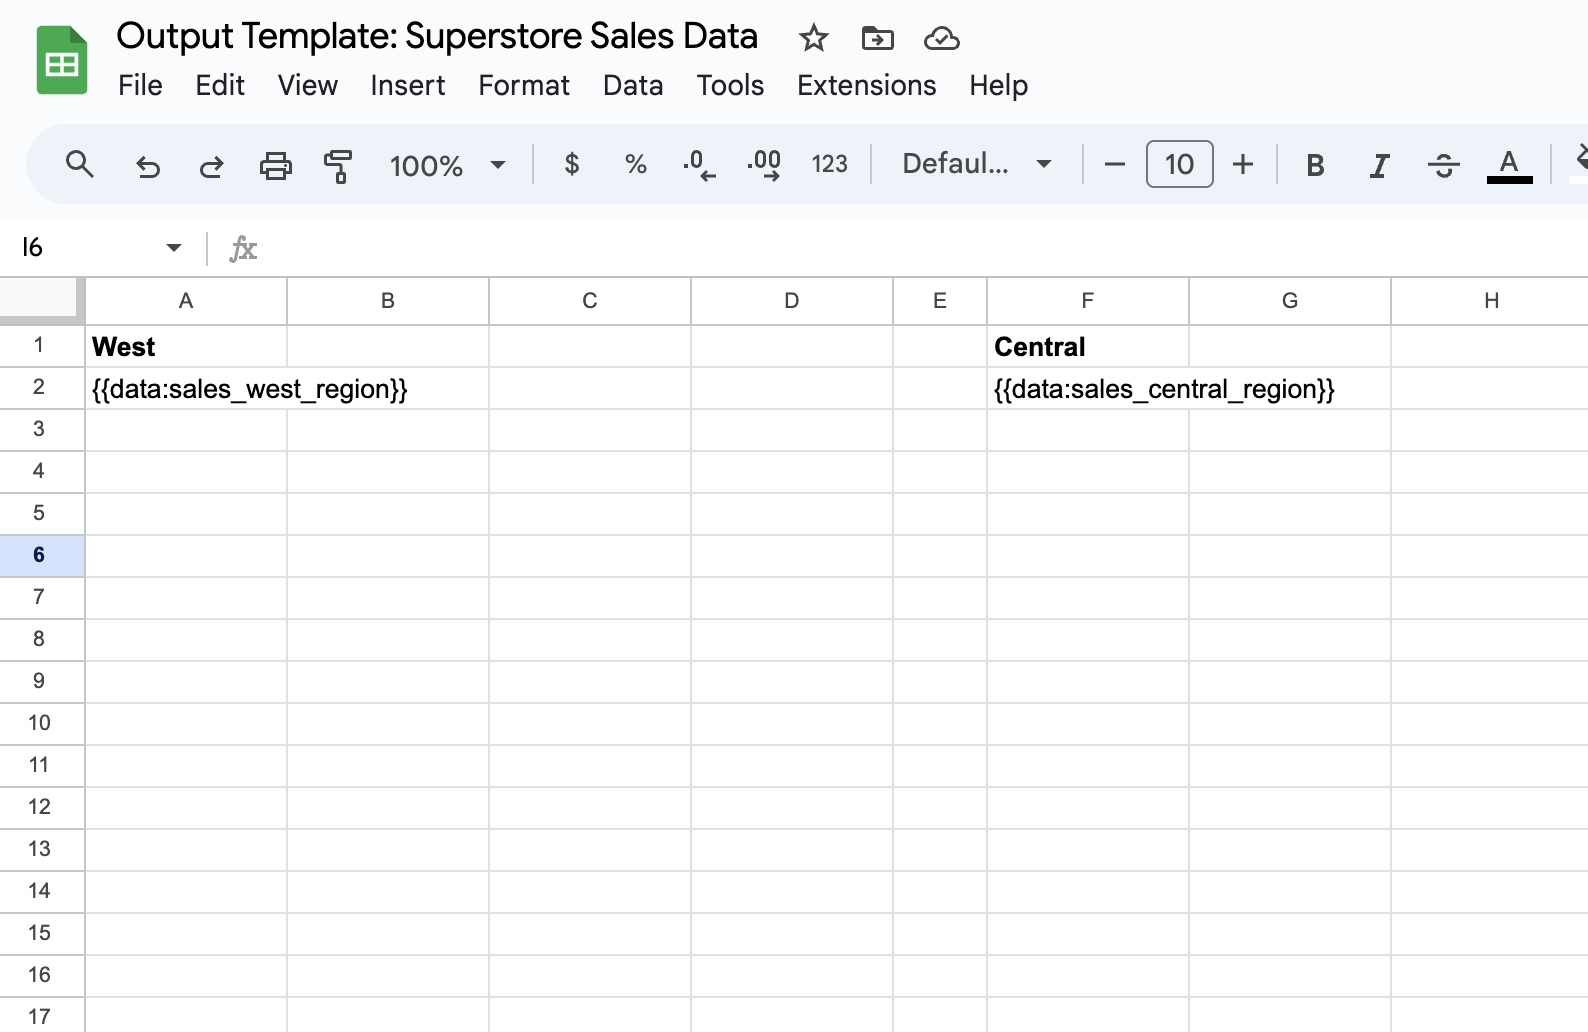
With Slideform, you can specify filters and layout of the data and also pull data from different data sources into the same sheet!
Save the template, either as a Google Sheet in your Google Drive workspace, or as an Excel file. Then upload it to Slideform as a New Project.
3. Match data to placeholders
The final step is to match each placeholder pragma to the appropriate data. Set the data source for each pragma in the Configure Data section of the project.
Slideform can do complex data filtering and lookups too! For more information see: How to Configure the Data Mapping. Save the data configuration once all pragmas are set.
In this example, I'll first select the chart from the dashboard and then select which columns of data to pull in. Then I can apply a filter to select the data from the West region and the Central region separately. I also set a sort order and a limit to the number of rows of data to pull.
4. Schedule the automation
Once the data and template are connected, you can trigger a data pull to the spreadsheet anytime by clicking Generate. Or you can set a schedule to run the exports and email you the results. In Settings you have the option to create a new output sheet each time, or to overwrite an existing Google Sheet.
With an automated workflow, you can pull in the data you need automatically for further analysis and manipulation. Add to the workflow by importing your spreadsheet data directly into reports and presentations.
Did you know? Slideform can insert data, charts, text, and images into your Google Slides and PowerPoint too!
Start your free trial today