
Send Real-Time BI Data in Emails
Most teams still share results by emailing a dashboard link or attaching a slide deck. While the data is there, stakeholders have to click, open, and navigate another tool just to see the key numbers—often resulting in reports that are skimmed or ignored.
Slideform’s Dynamic Email Reports remove that friction by embedding metrics and AI-generated insights directly into the email body. Stakeholders get the most important results immediately, with optional links to full dashboards or decks when deeper detail is needed.
Why Traditional Mail Merge Falls Short
Traditional email templates and mail merge tools were built for communication, not analytics. Gmail or Outlook mail merge pull from static spreadsheets or CRM exports, is limited to simple field substitution (name, date, number), and has no ability to calculate metrics or trends.
If your data lives in Looker Studio, Power BI, Tableau, or a data warehouse, you’re forced to export it first—locking in stale values and duplicating logic outside your BI stack.
Introducing AI-Powered Dynamic Email Reporting with Slideform
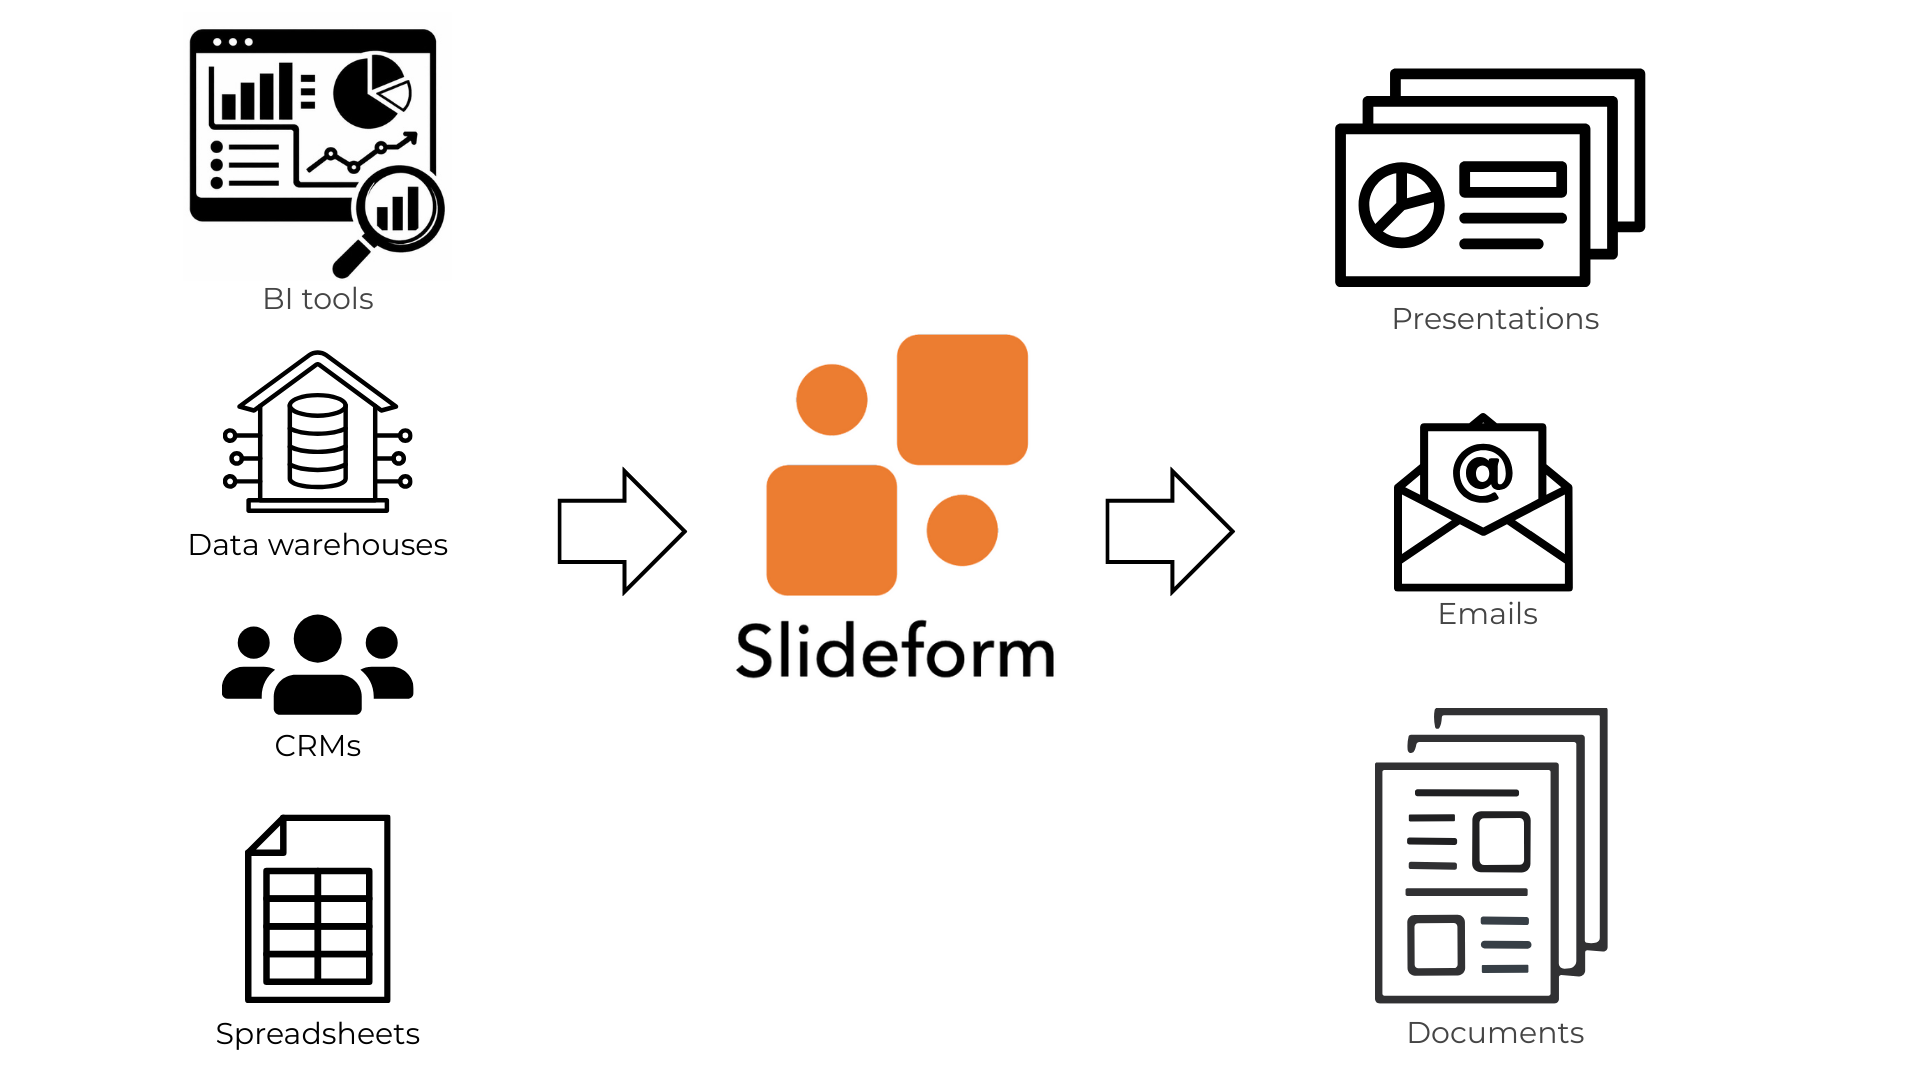
Dynamic Email Reports expand Slideform beyond slides and documents, adding email as an automated output alongside Google Slides and PowerPoint.
Just like slide automation, Dynamic Email Reports connect directly to live data and use AI to generate the final output at send time. With this new capability, Slideform:
-
Connects directly to 18+ BI dashboards, CRM platforms, and databases
-
Calculates metrics and summaries in real time
-
Generates narrative insights based on the latest data
- Constructs a branded template for the email
-
Embeds charts, metrics, and insights directly into the email body
Instead of sending links to dashboards or attaching static decks, Slideform creates the email content dynamically, using live data and AI-driven analysis.
AI That Calculates Metrics and Insights on the Fly
A key difference between Slideform and traditional email tools is that Slideform doesn’t just insert data—it analyzes it.
Using the Slideform AI Analyst, you can: calculate new metrics that don’t exist in the source, aggregate and compare time periods, generate executive summaries and key takeaways, or adapt messaging based on the latest results.
Every email is generated at send time, ensuring numbers and insights are always current.
Direct Connections to BI Dashboards and Databases
Mail merge tools depend on flat files. Slideform connects directly to your analytics stack. Slideform supports direct connections to:
-
BI dashboards (Looker Studio, Tableau, Power BI, and more)
-
Data warehouses (BigQuery, Snowflake, Redshift, etc.)
-
CRM platforms like Salesforce & HubSpot
- Operational tools like GitHub
No exports. No manual refreshes. No duplicated calculations.
One Automation Layer for Slides and Emails
With Slideform, dynamic email reports are not a separate workflow. The same data mappings and AI logic power automated slide decks and dynamic email reports.
This keeps every client-facing artifact aligned—emails, slides, and dashboards all tell the same story.
Example Use Cases for Dynamic Email Reports
Dynamic email reports are especially effective for recurring updates where stakeholders want immediate clarity without opening dashboards or attachments. Common examples include:
-
Weekly or monthly campaign performance emails
Automatically summarize key KPIs, trends, and highlights from marketing dashboards and deliver them directly to clients. -
Daily sales team updates
Send each rep or manager a daily snapshot of pipeline changes, deals closed, and activity metrics calculated from CRM and BI data. -
Weekly executive updates
Deliver a concise, AI-generated summary of top-line metrics, risks, and wins pulled from multiple data sources. -
Client status and health reports
Share account-level performance metrics and insights with customers, with optional links to full decks or dashboards. -
Operational or KPI monitoring emails
Send recurring operational summaries or alerts when metrics cross key thresholds.
In each case, the email itself becomes the report—powered by live data and AI-generated insights—while still allowing recipients to drill into full dashboards or slide decks when needed.
Real-world Example: From Email Template to Live Data
Below is a simple walkthrough showing how a dynamic email report comes together.
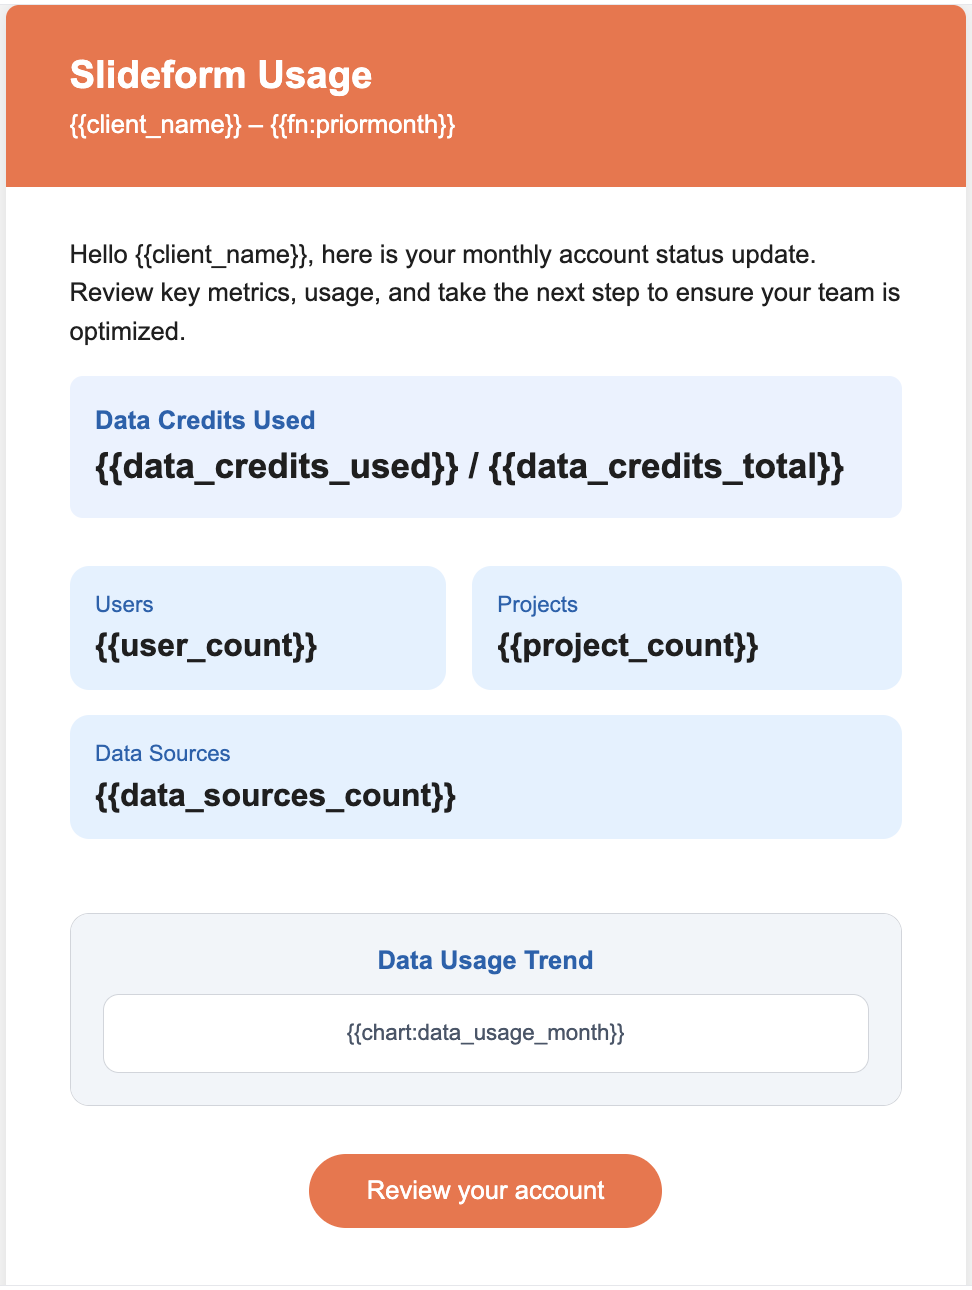
1. Generate an Email Template
Use Slideform's AI Assistant to design a branded email layout and define where metrics and insights should appear. This template works like a report—not a static email.
2. Connect Data and Apply AI Logic
Select your BI dashboard or database, define metrics, and let Slideform AI calculate summaries and insights automatically.
Connect your data in any of the dozens of supported data sources.
 |

|

|

|

|
Enter a prompt for the Slideform AI analyst to create a new table, chart, or insight from your data. The visuals can be formatted, colored, and resized to match your branding. Examples include:
Analysis of Google Search Console data from Looker Studio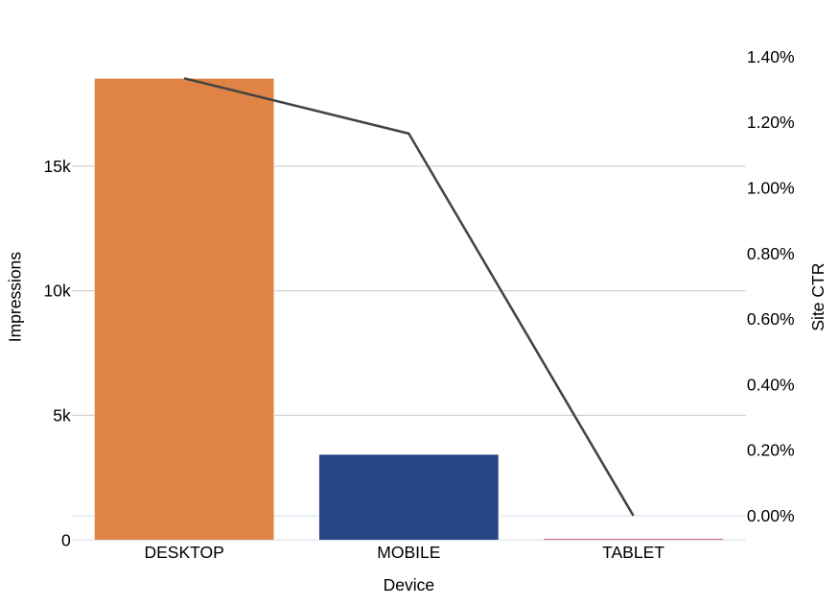
"Create a column chart of the number of impressions and the Site CTR for each device type. Device should be on the x-axis. Show the Impressions on the left y-axis and CTR on the right y-axis. Show the CTR line in black."
"Examine the number of impressions per week over the past 3 months. Identify any upward or downward trends in the data relative to the baseline expectation of 10,000 impressions per week."
Response - Weekly impressions were above the 10,000 baseline each week and are trending downward for the past 1 week.
3. Send the Customized Email on a Schedule
The final email arrives with up-to-date metrics and insights embedded directly in the body—no attachments required.
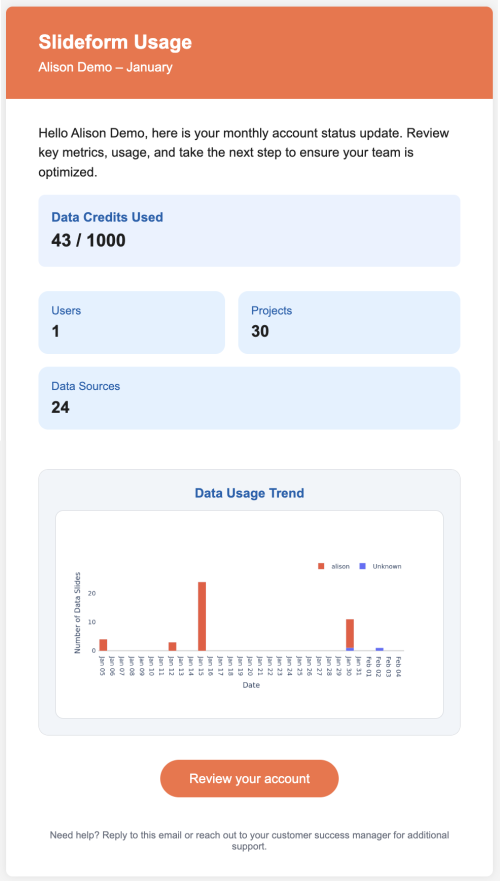
You can optionally include links to full slide decks or dashboards for deeper exploration.
Why AI-Powered Email Reports Work Better
Dynamic email reports are ideal when:
-
Stakeholders want fast, scannable insights
-
Metrics must be recalculated each send
-
Data comes from multiple BI tools
-
Accuracy and consistency matter
Instead of sending an email about a report, Slideform lets you send the report itself, powered by live data and AI.
Takeaway
Marketing email templates and mail merge were never designed for analytical reporting. They personalize messages—but they don’t understand data.
Slideform’s AI-powered Dynamic Email Reports transform email into a true reporting channel by connecting directly to BI dashboards and databases, calculating metrics and insights automatically, and delivering results straight to the inbox—all from a single platform.
