Slideform automation puts your reports on auto-pilot. Embed any content from Sigma into a presentation, apply filters, and set a schedule to update the slides automatically.
Why use PowerPoint for reporting?
Some may wonder why we use PowerPoint for client-facing reporting. Slide decks are by far the best storytelling vehicle. Dashboards are useful for self service exploration but business stakeholders need to be presented with a coherent story based on data. There are other good reasons to send your clients a report in PowerPoint format.- A PowerPoint deck can be customized to each client or exec so they see only the data that is most relevant to them.
- A slide deck does not change over time, so they can always refer back to it.
- Presentation format is easy to step through together during a meeting.
- You can add comments and recommendations that are relevant to the specific data in the slides.
- The slide deck can be styled according to the client's branding guidelines or your corporate style guide.
- You can share the presentation directly with the recipients over email.
What are some options to insert Sigma content into PowerPoint?
- The best way to export Sigma charts and visuals directly to your customized PowerPoint report is with Slideform. Slideform uses AI-powered automation to map your Sigma content to shapes and text boxes on a PowerPoint template. You can apply filters to the data automatically, crop the chart images, set an update schedule, and create multiple presentations at once. Learn more at https://slideform.co.
- You could also manually copy and paste from Sigma to PowerPoint. This puts a static image of the visual into your presentation. The limitation is that you have to copy over every single data element and chart, and if the data changes you will have to copy them over again.
How to automatically import Sigma charts into PowerPoint
-
Connect your Sigma workbook to Slideform
First, create a personal access token in Sigma, then, in Slideform, add the Sigma data source and provide the requested credentials. For more details on setup, see How to Connect A Data Source.
Slideform captures each visual in the worksheet, including charts, tables, maps, and metrics, and makes it available to embed into your PowerPoint template. Slideform also extracts all of the data behind each of the visuals. You can use this to fill in text boxes in the presentation and to construct editable tables in your slides.
Here is a sample Sigma dashboard. I want to filter this dashboard to the date range of Last Week, and then embed the Conversion Count chart and the Total Users KPI into a report in PowerPoint.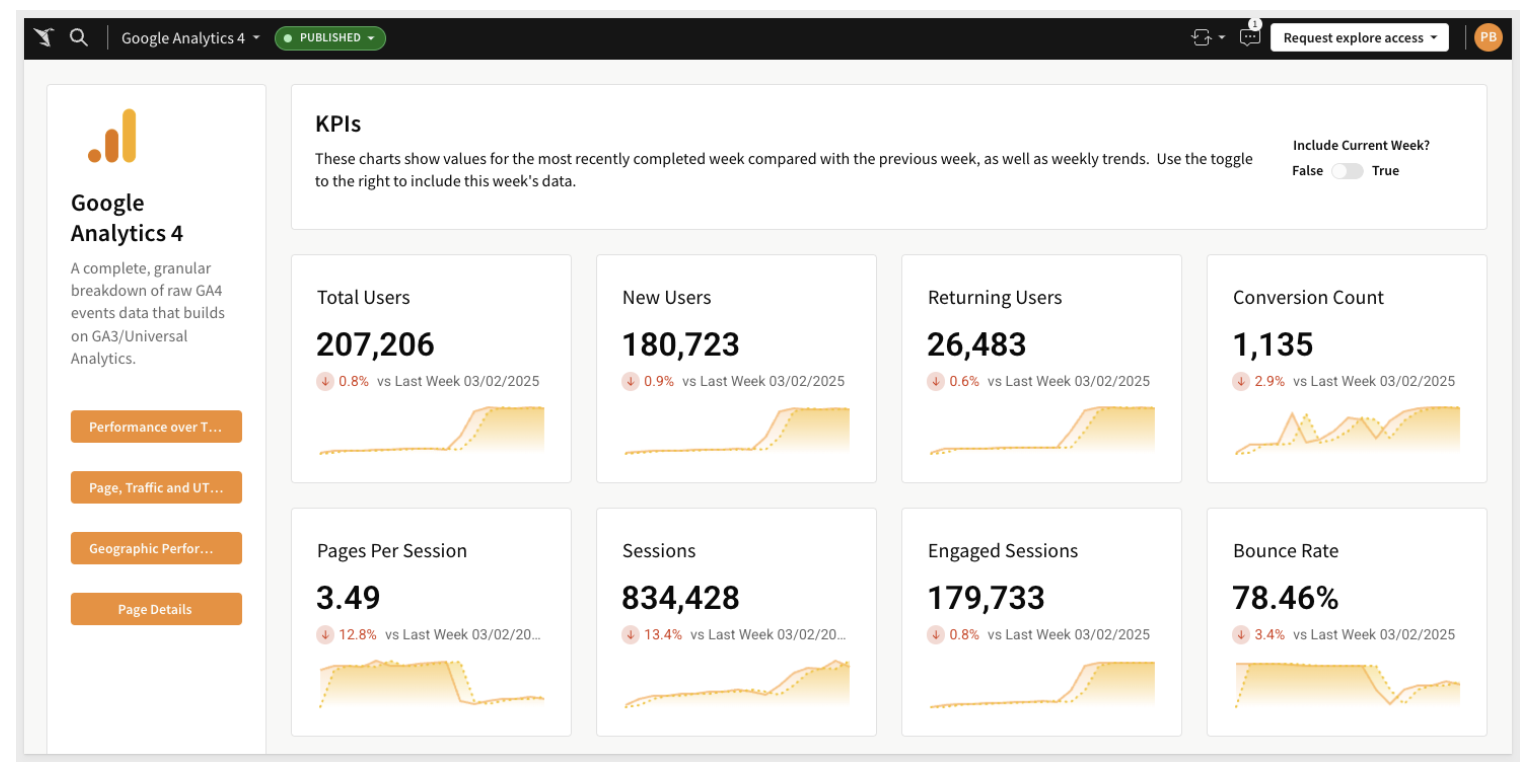
- Connect a PowerPoint presentation template
Next, you need a template for your presentation. With Slideform, you can use your own custom-branded deck. Just start with a previous version of your report and insert placeholders (enclosed in curly braces) for any elements that will change between versions of the report, like text, numbers, tables, images, charts, logos, and names. All the colors, styling, fonts, and sizing of the elements in the template will be carried through to the PPT output.
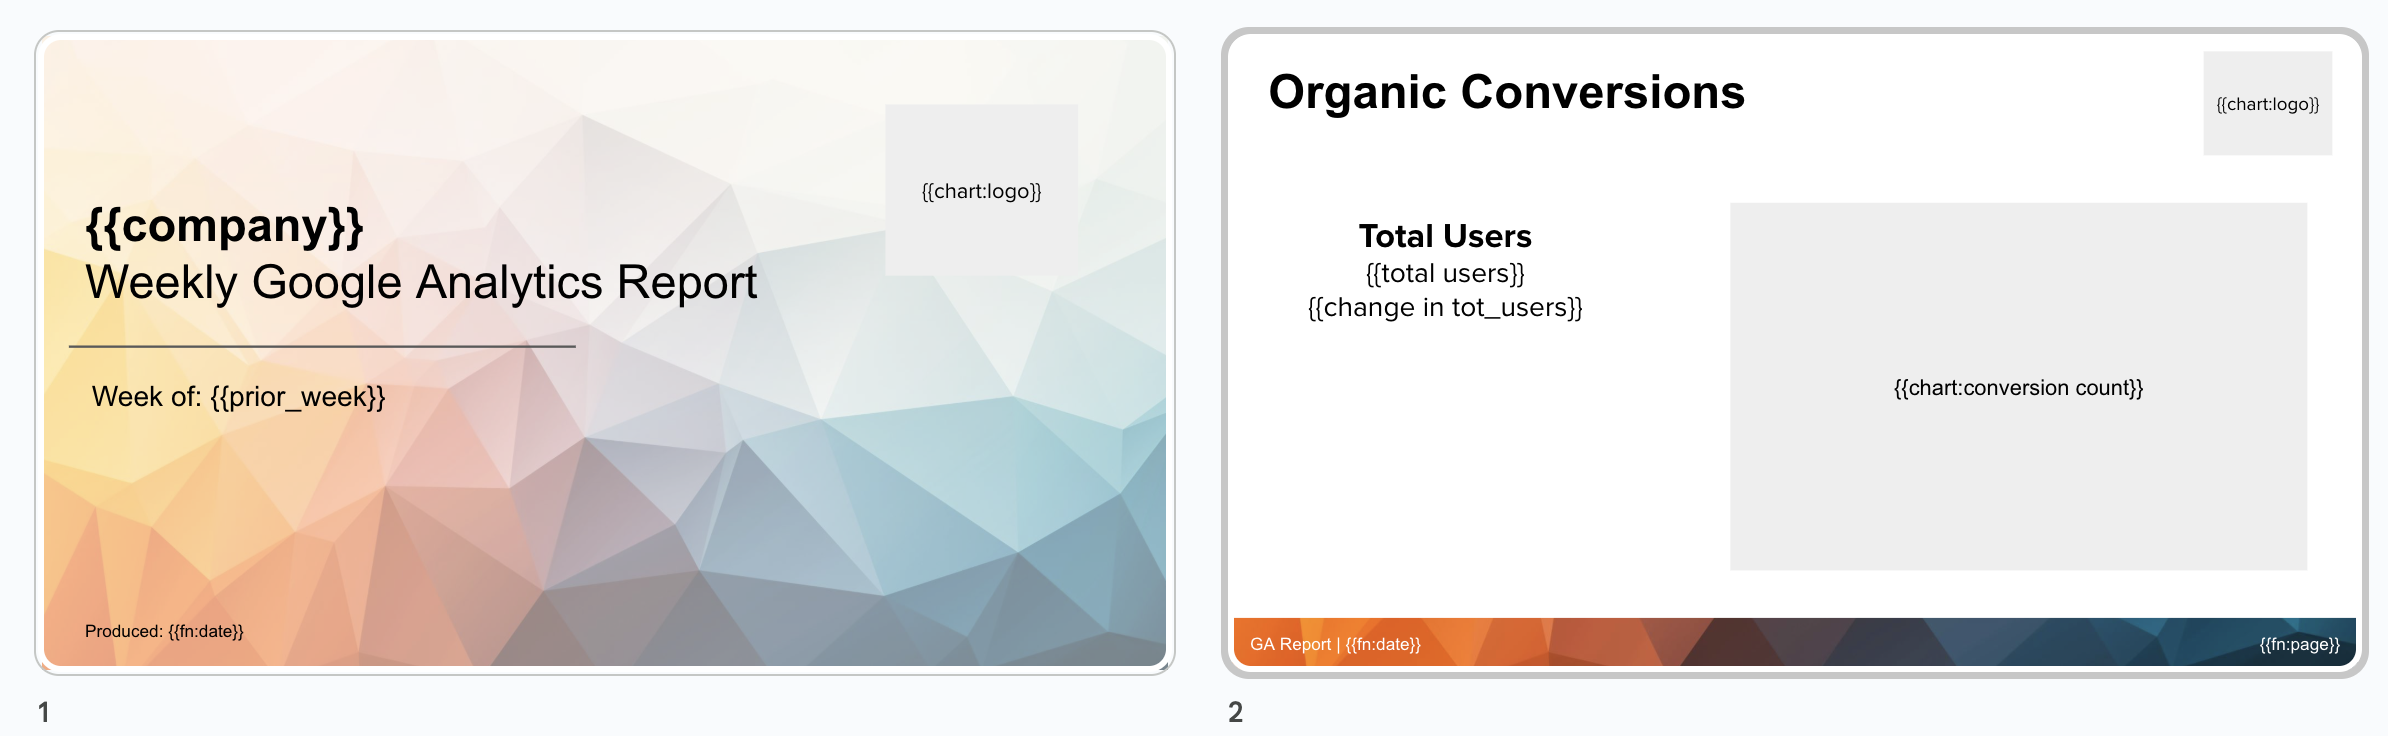
Here is an example slide template with placeholders for text and charts from Sigma.
Once you have saved a template, enter the slides into Slideform as a New Project. Give your project a name and associate the Sigma data source. - Match Sigma charts and metrics to the placeholders
Now, we need to match each placeholder in the slide template to the correct chart or other content that will fill it. Open the project for editing by clicking Configure Data on the project card. Select the data source, then choose the chart or table. You can filter the data with any filters that are included in your dashboard, such as date range, category, or region. Tables are embedded as editable, native PowerPoint tables.
To pull in a number, such as a KPI or metric, it is a similar process. We pull in the data behind Sigma scorecards and tables and you can filter and perform functions to select the data you want to use. The metric will be embedded as an editable text field in the presentation.
- Generate the PowerPoint presentation
Click Generate to make a new, up-to-date presentation. You can also Set a Schedule for Recurring Presentations to auto-generate and email the slides to you. Or, create several slide decks with different filter settings using Bulk Mode. Awesome, right!
Here is my report, filtered to last week, with the Sigma data and chart filled in.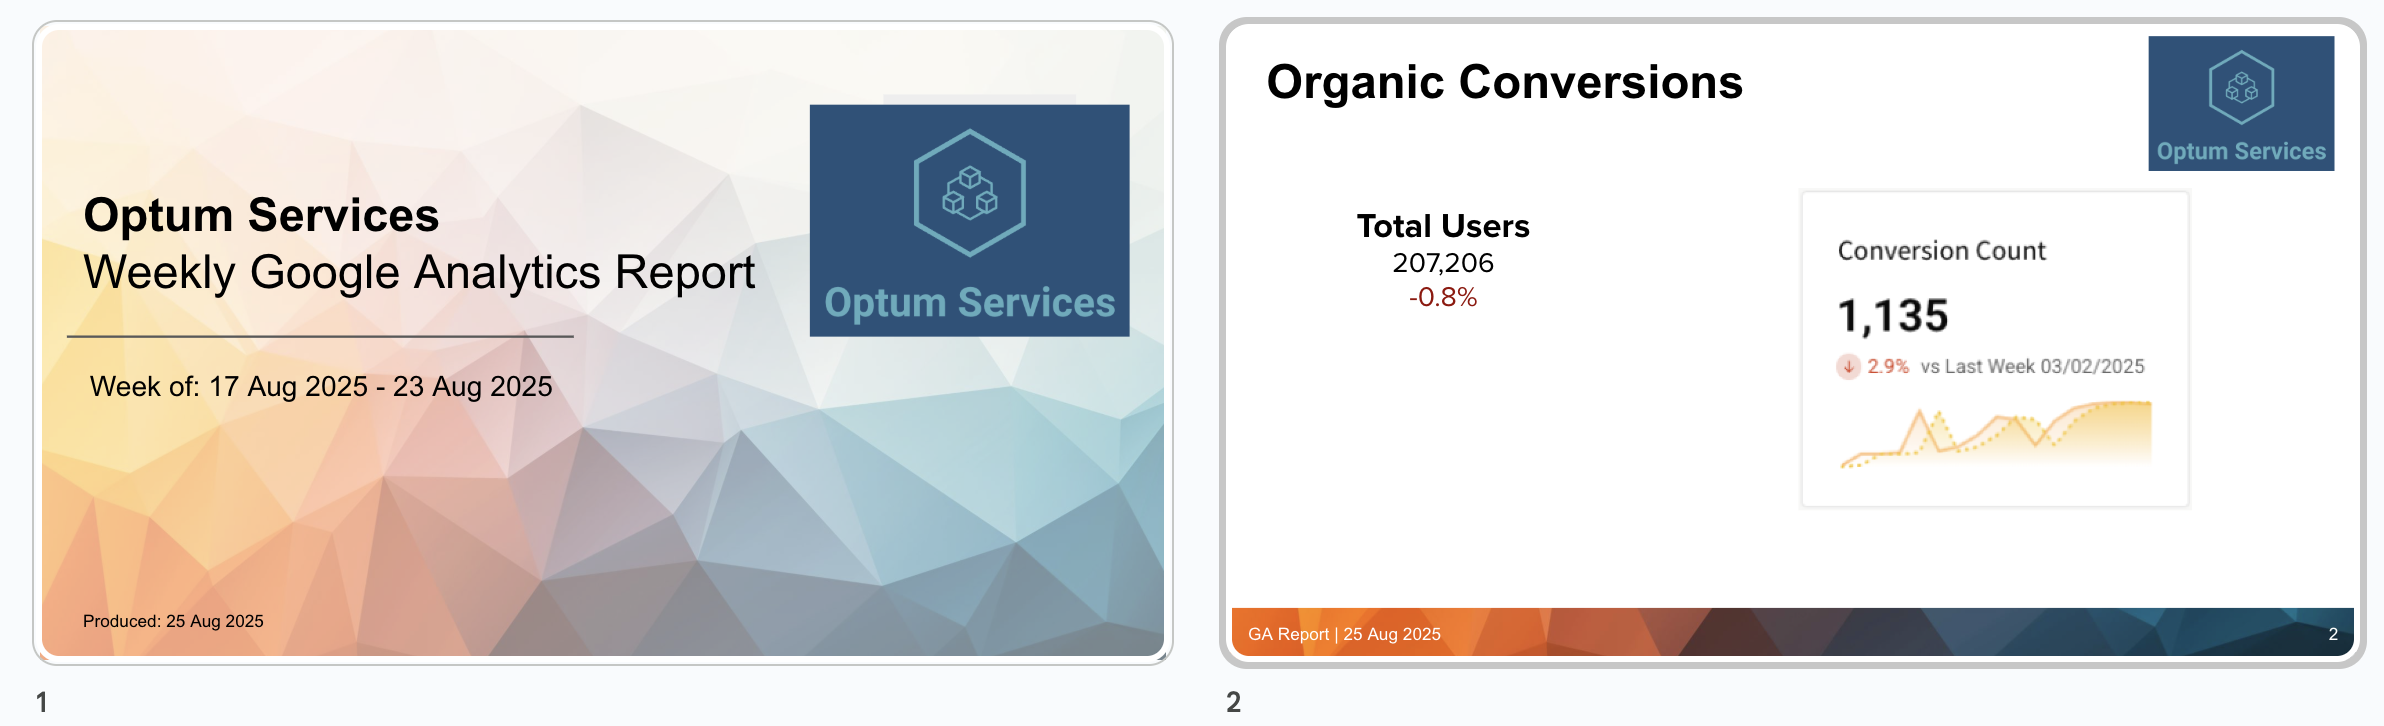
Advantages of Slideform automation:
- No screenshots! And no copying & pasting.
- Set recurring presentations to auto-generate on a schedule.
- Slides are viewable by all recipients; no Sigma license required.
- Data (charts, graphs, numbers) automatically update when you generate a presentation.
- Combine Sigma with other data sources and content including spreadsheets, images, and text.
- Use your own custom slide template in the format of your choice.
Can I embed Sigma visuals into Google Slides or PDFs?
Yes! Slideform fully supports Google Slides. Slideform automation is the best choice to merge Sigma data to all your reports.
Start your free trial today!