Do you report on HubSpot data in PowerPoint or Word? You may find yourself copying data over from...
Integrate HubSpot with Google Slides and Docs
Do you report on HubSpot data in Google Slides or Docs? You may find yourself copying data over from HubSpot for QBRs, onboarding decks, or internal reports. This is where Slideform's smart automation can help!
Learn how to connect HubSpot's CRM to Slideform to fill in text, metrics, and data in your reports automatically.
Slideform is the powerful, no-code solution to link HubSpot to Slides & Docs to automatically generate presentations & reports on demand or on a schedule.
How to automatically generate Slides or Docs with HubSpot data
1. Connect HubSpot to Slideform
Slideform integrates with HubSpot CRM and Dashboards and many other sources. From Slideform, you can query HubSpot to pull in property values, including custom properties, from any of the following HubSpot objects:
-
Deals
Deal name, description, amount, deal stage, dates, activities, deal owner ID, and more.
-
Companies
Name, close date, last engagement date, number of open deals, contacts, company owner, and more.
-
Contacts
Name, email, job title, lead status, lifecycle stage, last engagement date, original traffic source, time zone, and more.
-
Products
Name, price, description, business unit, owner, SKU, and more.
-
Quotes, Invoices, & Line Items
Access all properties of these objects in internal reports and client-facing decks.
Connect a HubSpot dashboard to pull in charts and tables. Learn how at Export HubSpot Dashboards to PowerPoint or Slides
In this example, I will be using data from Deals in my sales pipeline. Here's my Deals board:

To connect HubSpot to Slideform, first log into HubSpot. In Slideform, go to Data Sources and Add Data Source. Click Add Integration on the HubSpot CRM card and follow the instructions from there.
2. Create a Google Slides or Docs template

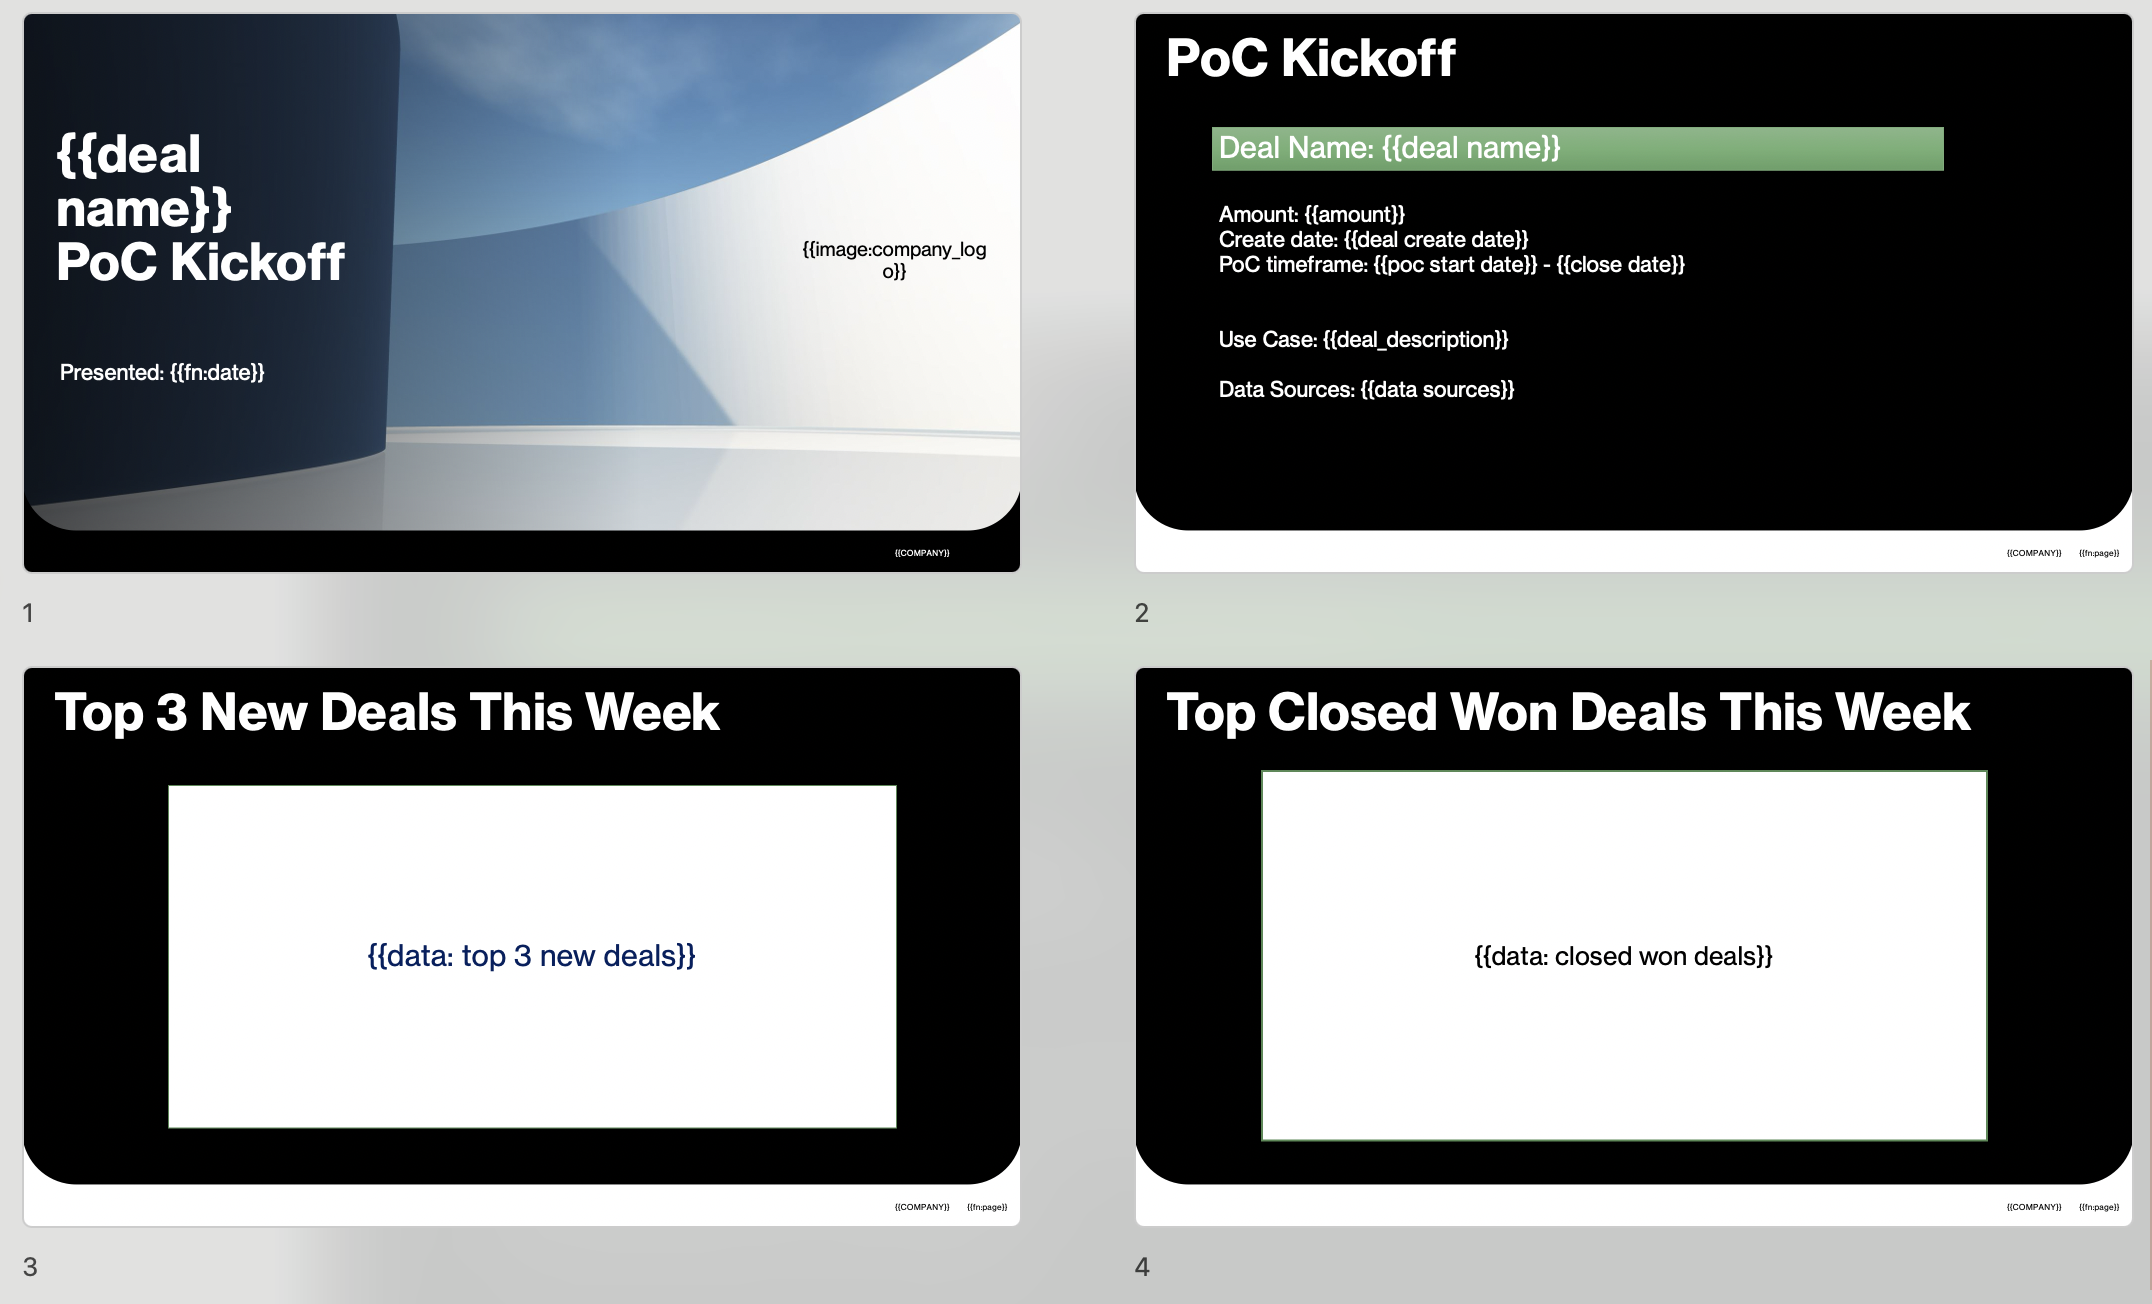
{{ and }} To create a Google Doc template, add placeholders enclosed in curly braces such as{{metric1}}into the document. Charts and tables will be placed inline with the text.
3. Connect data to your template in Slideform
The last step is to connect data to each placeholder in the template. Each placeholder has a box on the Configure Data page where you select the data source and specific object and property from HubSpot.
Pull in a property value for a specific object
For the {{amount}} placeholder, I want to pull the $ Amount from a specific Deal object. To do this, select the data source, Deals object (in the "worksheet" dropdown) and the Amount property (in the "metric" dropdown). The dollar sign and currency formatting can be set in Slideform too. I use filters to look up the Deal that I want.
You can also apply a function such as sum or max to summarize information. In this example video, we pull in the total amount of all deals in the "quote sent" stage from HubSpot.
Pull in a table of objects with selected properties
For data tables, such as "Top Closed Won Deals This Week" on slide 4, marked by the {{data: closed won deals}} placeholder, we pull in specific properties for each deal and display them in a table. I set the data source, Deals object (in the "worksheet" dropdown) and Deals table. Then I select which properties I want to display in the Columns dropdown. I set the sort order and then filter the data to show only the Closed Won deals. I can also set a maximum number of rows to display so the table doesn't get too big.
Slideform is configurable! For more information see: How to Configure the Data Mapping
4. Generate the report
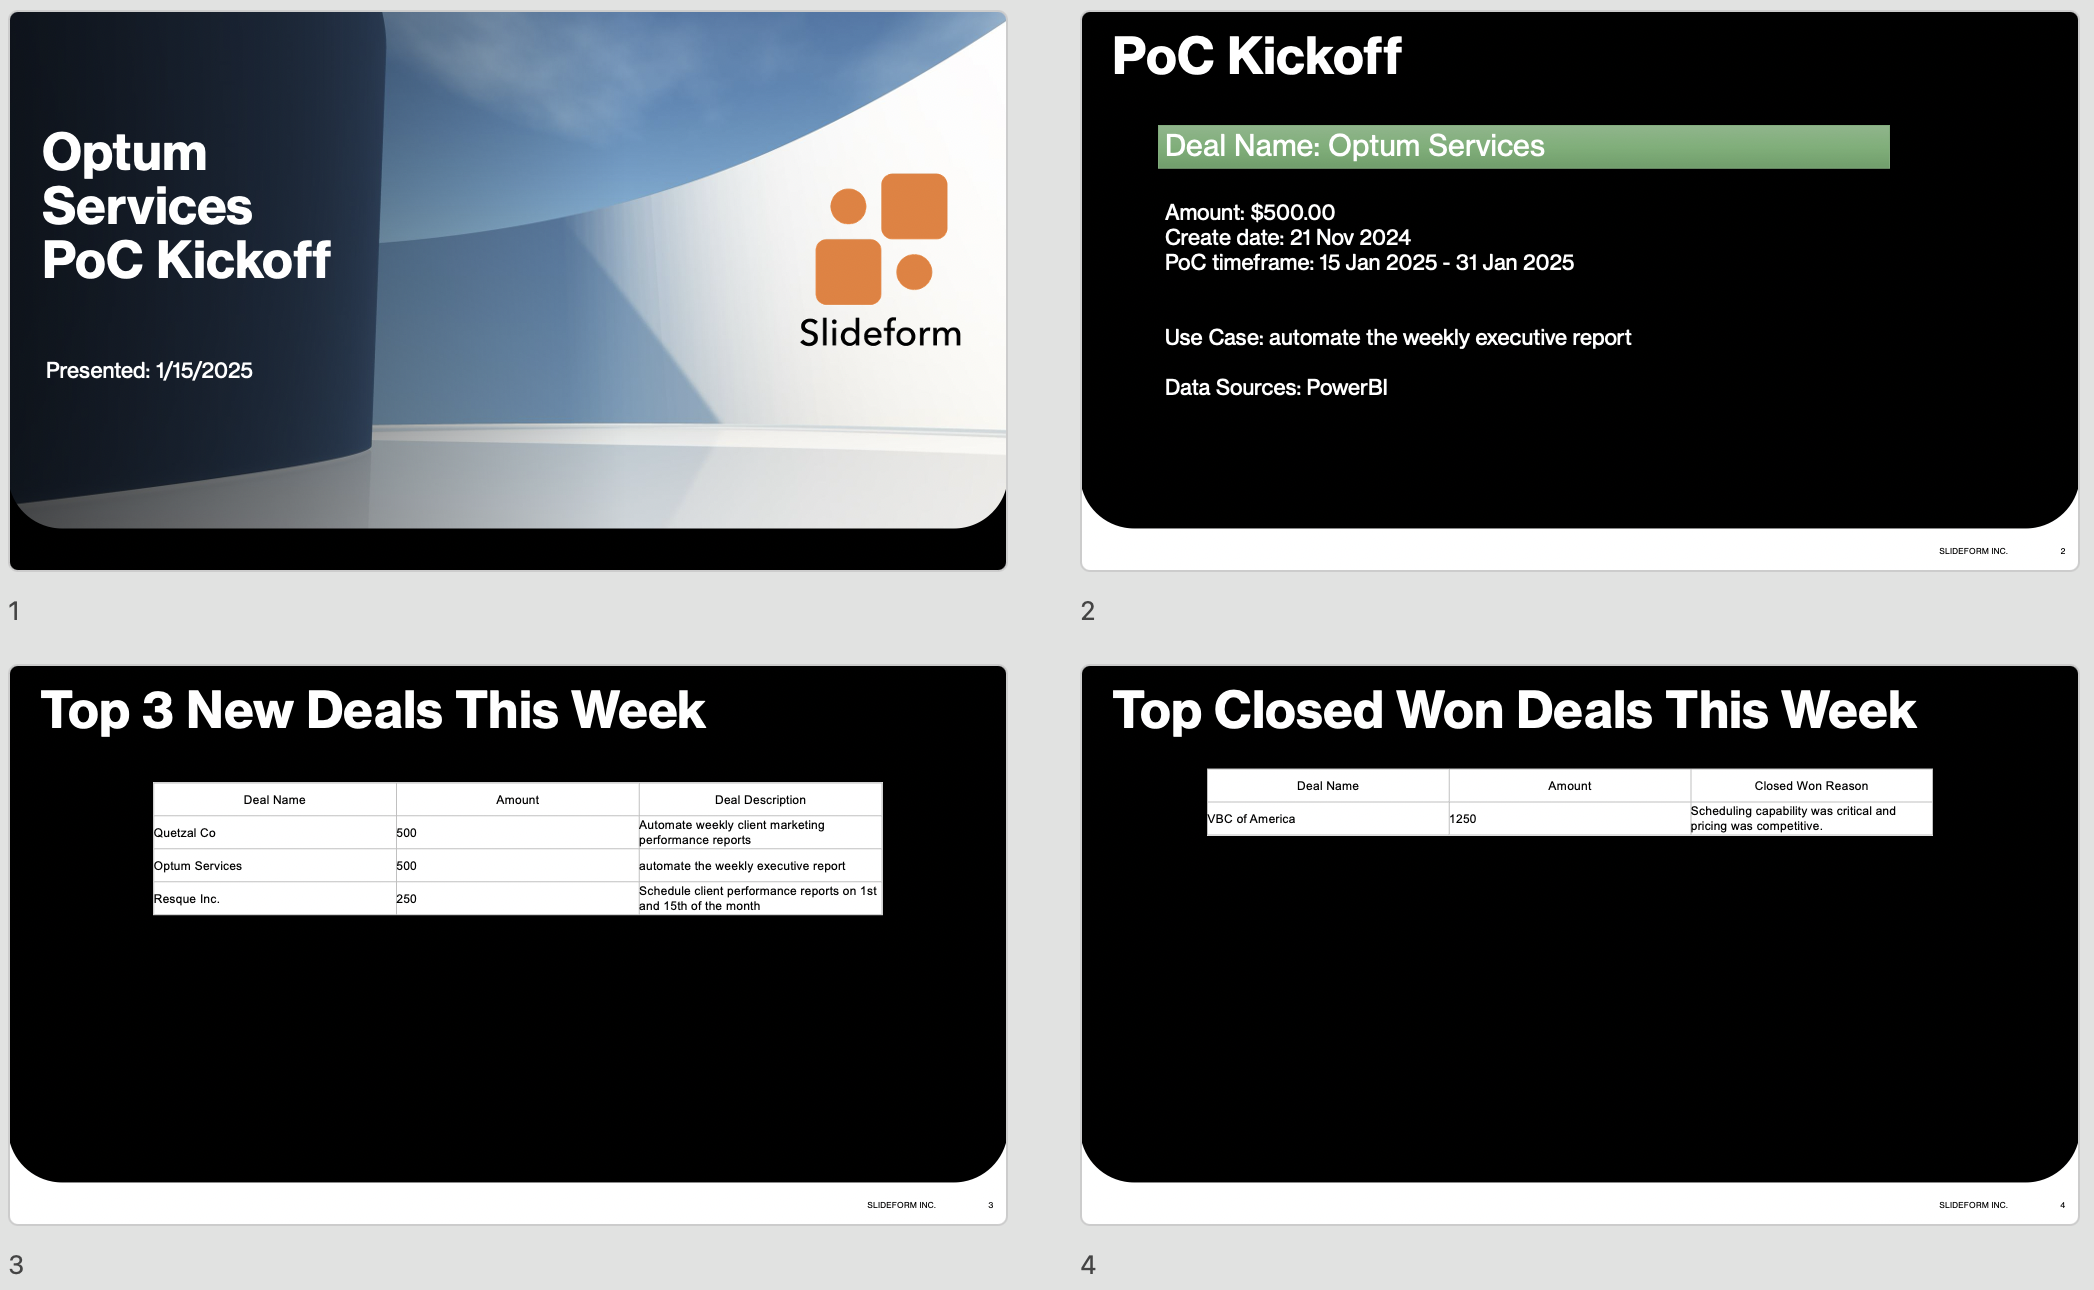
Now that my template and data are set up, I can generate a Google Slides deck whenever I need to by clicking Generate. Here's the output for the Optum Services deal object. All the data on slide 2 is filtered to that specific deal.

Now for the fun part! Automate!
Let’s generate a presentation for each my Deals in the PoC stage. All I have to do is go to my project and click Generate. I choose the Deal from a dropdown menu, click next and the slides are ready. No more copying and pasting!
I hope you’ve enjoyed this intro to integrating HubSpot with Google Slides. Get in touch with Slideform at https://www.slideform.co/


