Salesforce is the system of record for many organizations, capturing leads, pipeline metrics, account health, and campaign performance. But translating that data into clear, visual insights for clients, executives, or teams often requires a convoluted workflow: exporting to Google Sheets, creating charts manually, and formatting slides for consistency.
That process is now fully automatable. With Slideform's AI-powered reporting agent, you can generate custom charts and visualizations in presentations directly from Salesforce data—no manual formatting or spreadsheet exports required.
Introducing the AI-powered data analyst for Salesforce
What is Slideform?
Slideform provides AI for business analytics. Connect your data, tell us what you need, and get custom charts, metrics, and insights in seconds. Results can be embedded into branded, reusable templates, making reporting fast, consistent, and scalable.
Slideform Capabilities
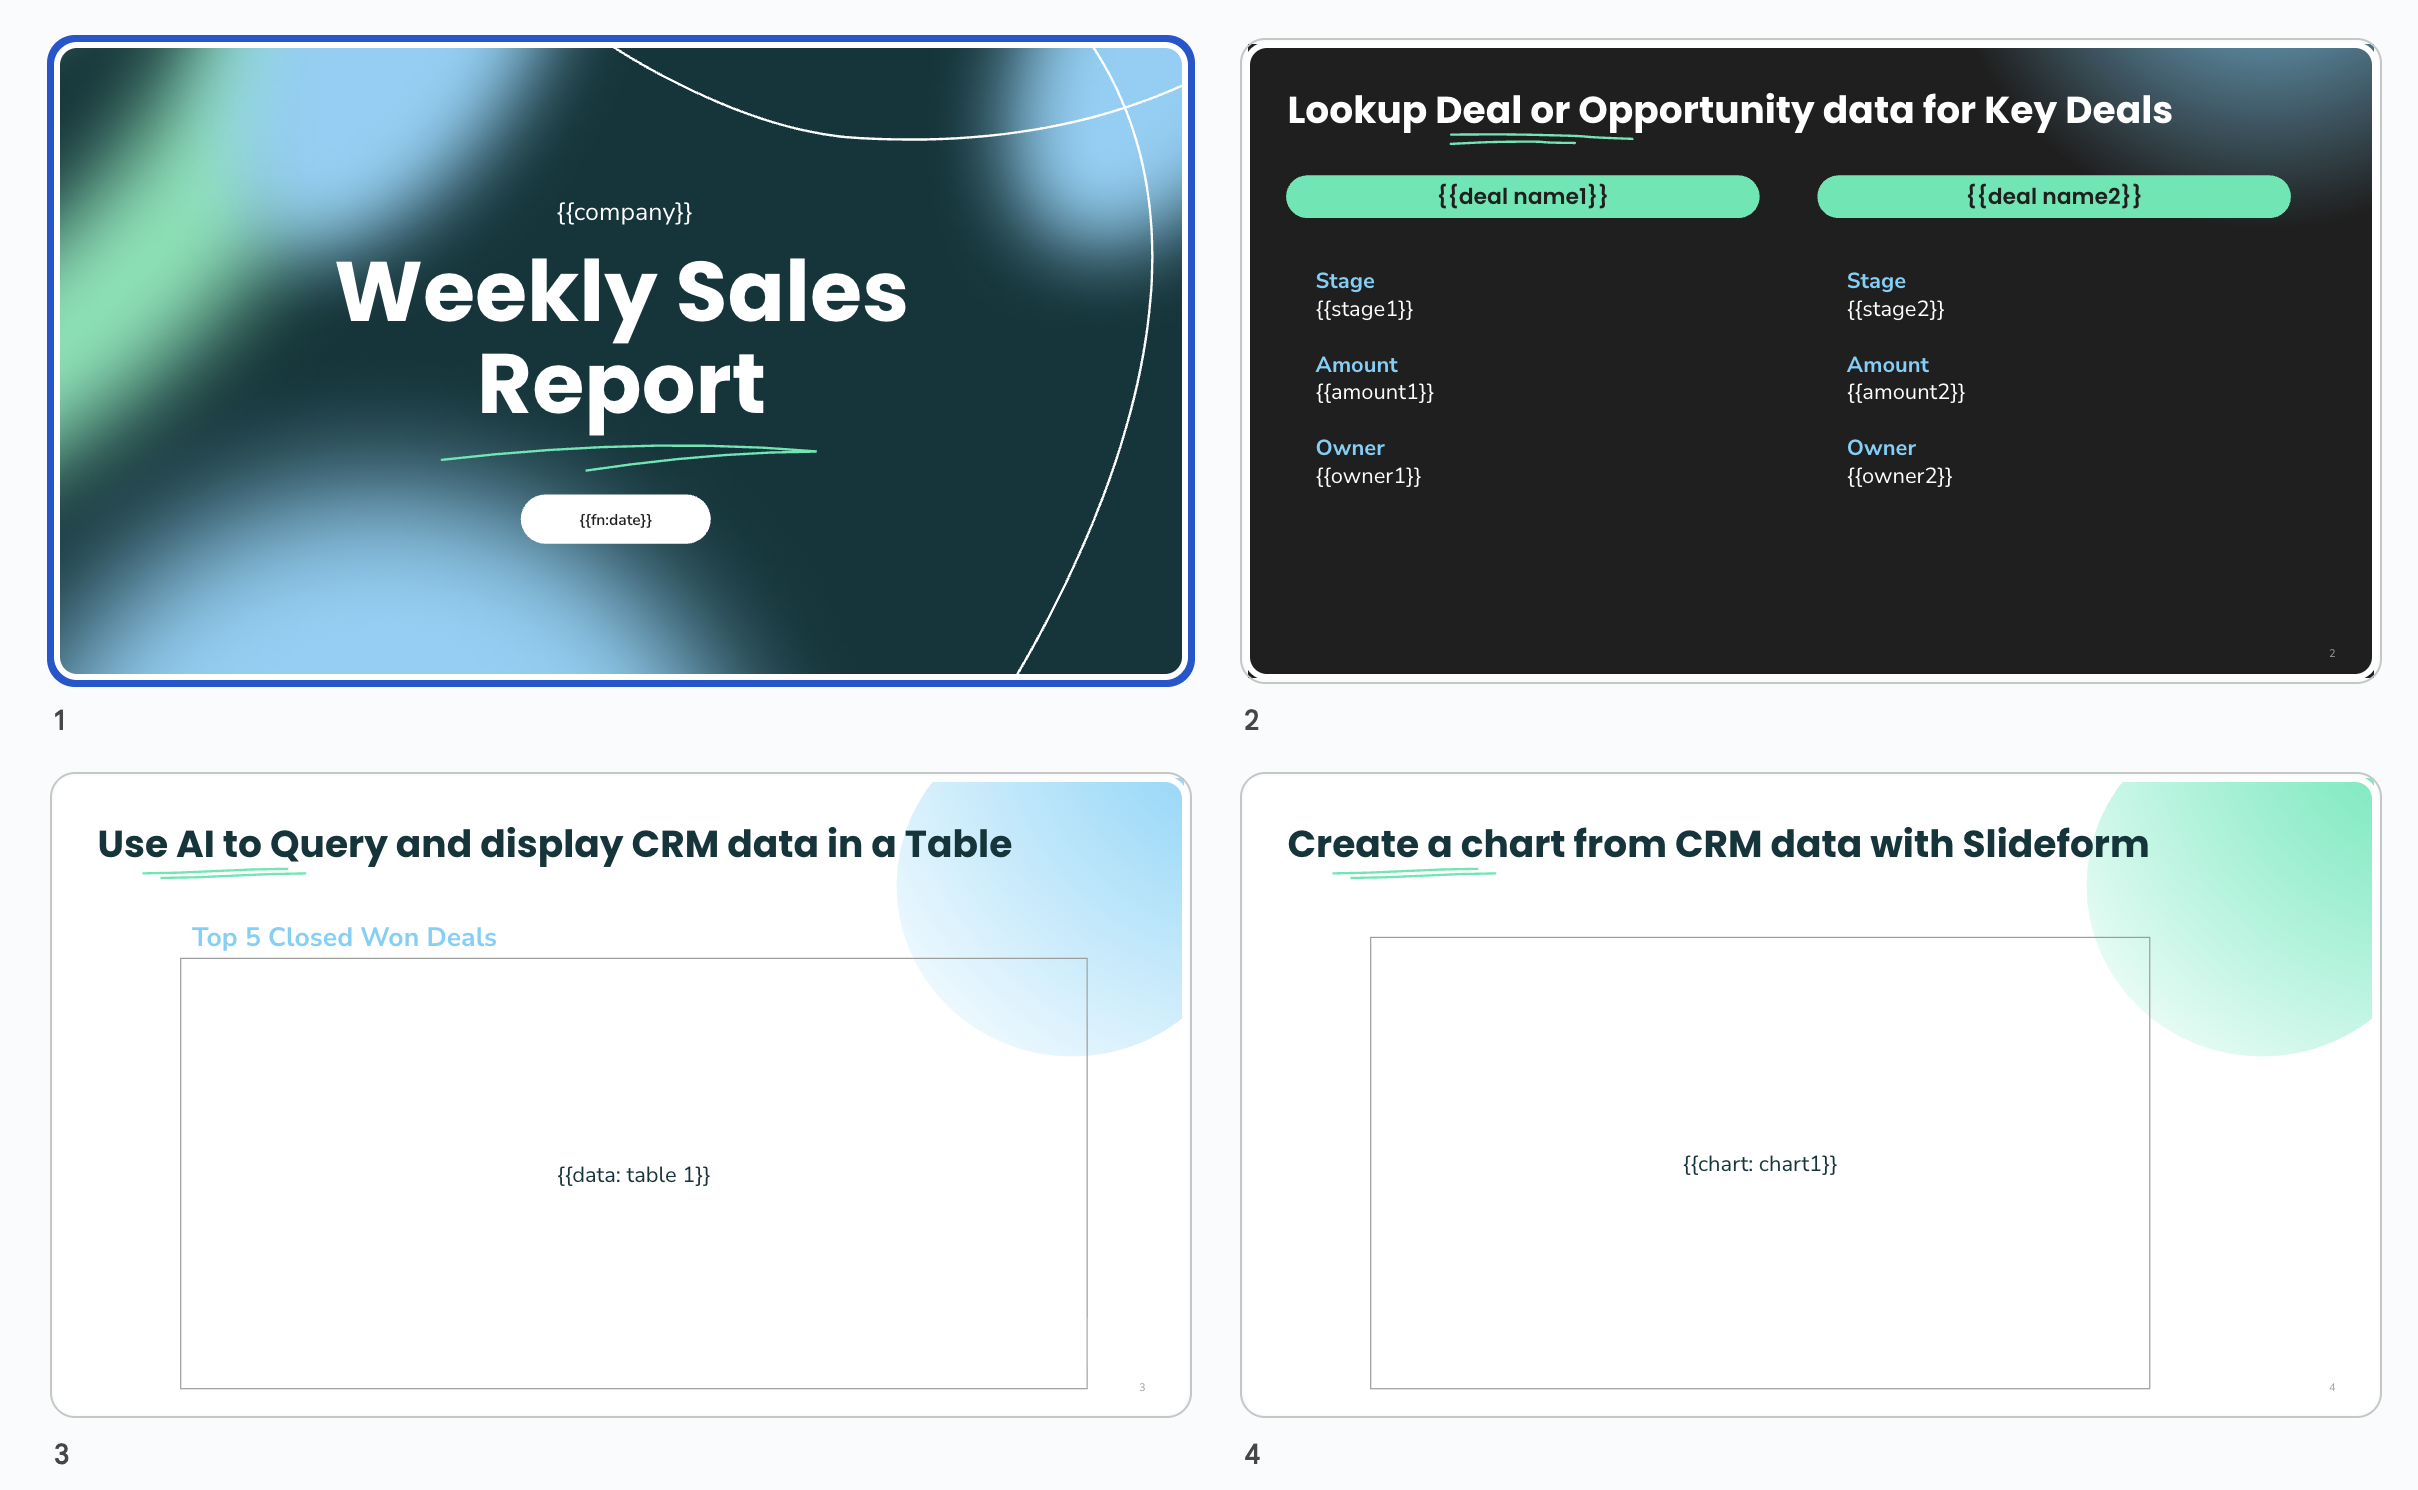
- Lookup an Opportunity and create a deal summary in Google Slides
- Generate charts from Salesforce data
- Dynamically update slides with new data
- Merge data from Salesforce into structured documents, PDFs, or reports
- Create new customized visuals (like charts & tables) and embed into reports
- Schedule reports to update automatically
How to Turn Salesforce Data into Google Slides Visuals with AI
Slideform integrates with numerous dashboards, CRMs, and databases to automate the creation of presentations and reports. Here's a quick overview of how it works with Salesforce.
In this example, we will explore the following use case →
Create a weekly sales team review in Google Slides with data pulled from Salesforce. Create charts and visuals of sales data without exporting data to a spreadsheet
1. Connect Salesforce
Slideform connects to Salesforce using secure OAuth authentication, with read-only access to your CRM objects such as Opportunities, Contacts, Products, Accounts, Cases, and custom properties & objects. Once connected, the agent can:
-
Query Salesforce records dynamically (e.g., top 5 closed won deals)
-
Apply filters by owner, stage, segment, etc.
-
Group and summarize records for visual representation (e.g., table of new deals by region)
-
Detect outliers and trends using AI logic
Tables are rendered as editable Google Slides tables, which ensures they match your branding and template specifications.
2. Enter a prompt
You can issue prompts and Slideform will generate the appropriate visualization automatically. This includes:
-
Bar, column, pie, and line charts and stacked bar charts for multi-dimension comparison
Charts are rendered using Slideform's charting engine, which ensures they match your branding and template specifications.
Example prompt:
"Create a pie chart of the amount of open opportunities grouped by the lead source. Remove the title and legend. Put data labels for amount and Lead Source on each pie slice."
Use prompts to do calculations and summarize data too:
-
KPI calculations (e.g. days to close, new contacts created)
- Insights and text summaries (e.g. Which region had the most new Opportunities created this month?, What is the Year-over-year change in Accounts in APAC?)
Example prompt:
"Calculate the average number of days to close for deals that are closed won. Provide only the number of days, rounded to the nearest whole number."
3. Use your own Google Slides template
Create a report template in Google Slides. This template acts as a blueprint for your reports, defining where key metrics, data, and text will be placed. Text and numbers can be pulled into text boxes on the slides or they may be placed within the cells of a table. Charts and data tables can be inserted into a rectangular shape on the slide.
Once the template is loaded, simply match the visuals and data to the appropriate place on each slide in the Slideform app.
4. Custom Visuals Automatically Inserted Into Presentations
Once the charts are generated, Slideform maps them into your Google Slides templates with precision. Each placeholder (e.g. {{chart:chart1}}) is replaced with the AI-generated chart, automatically sized and styled to fit your layout.
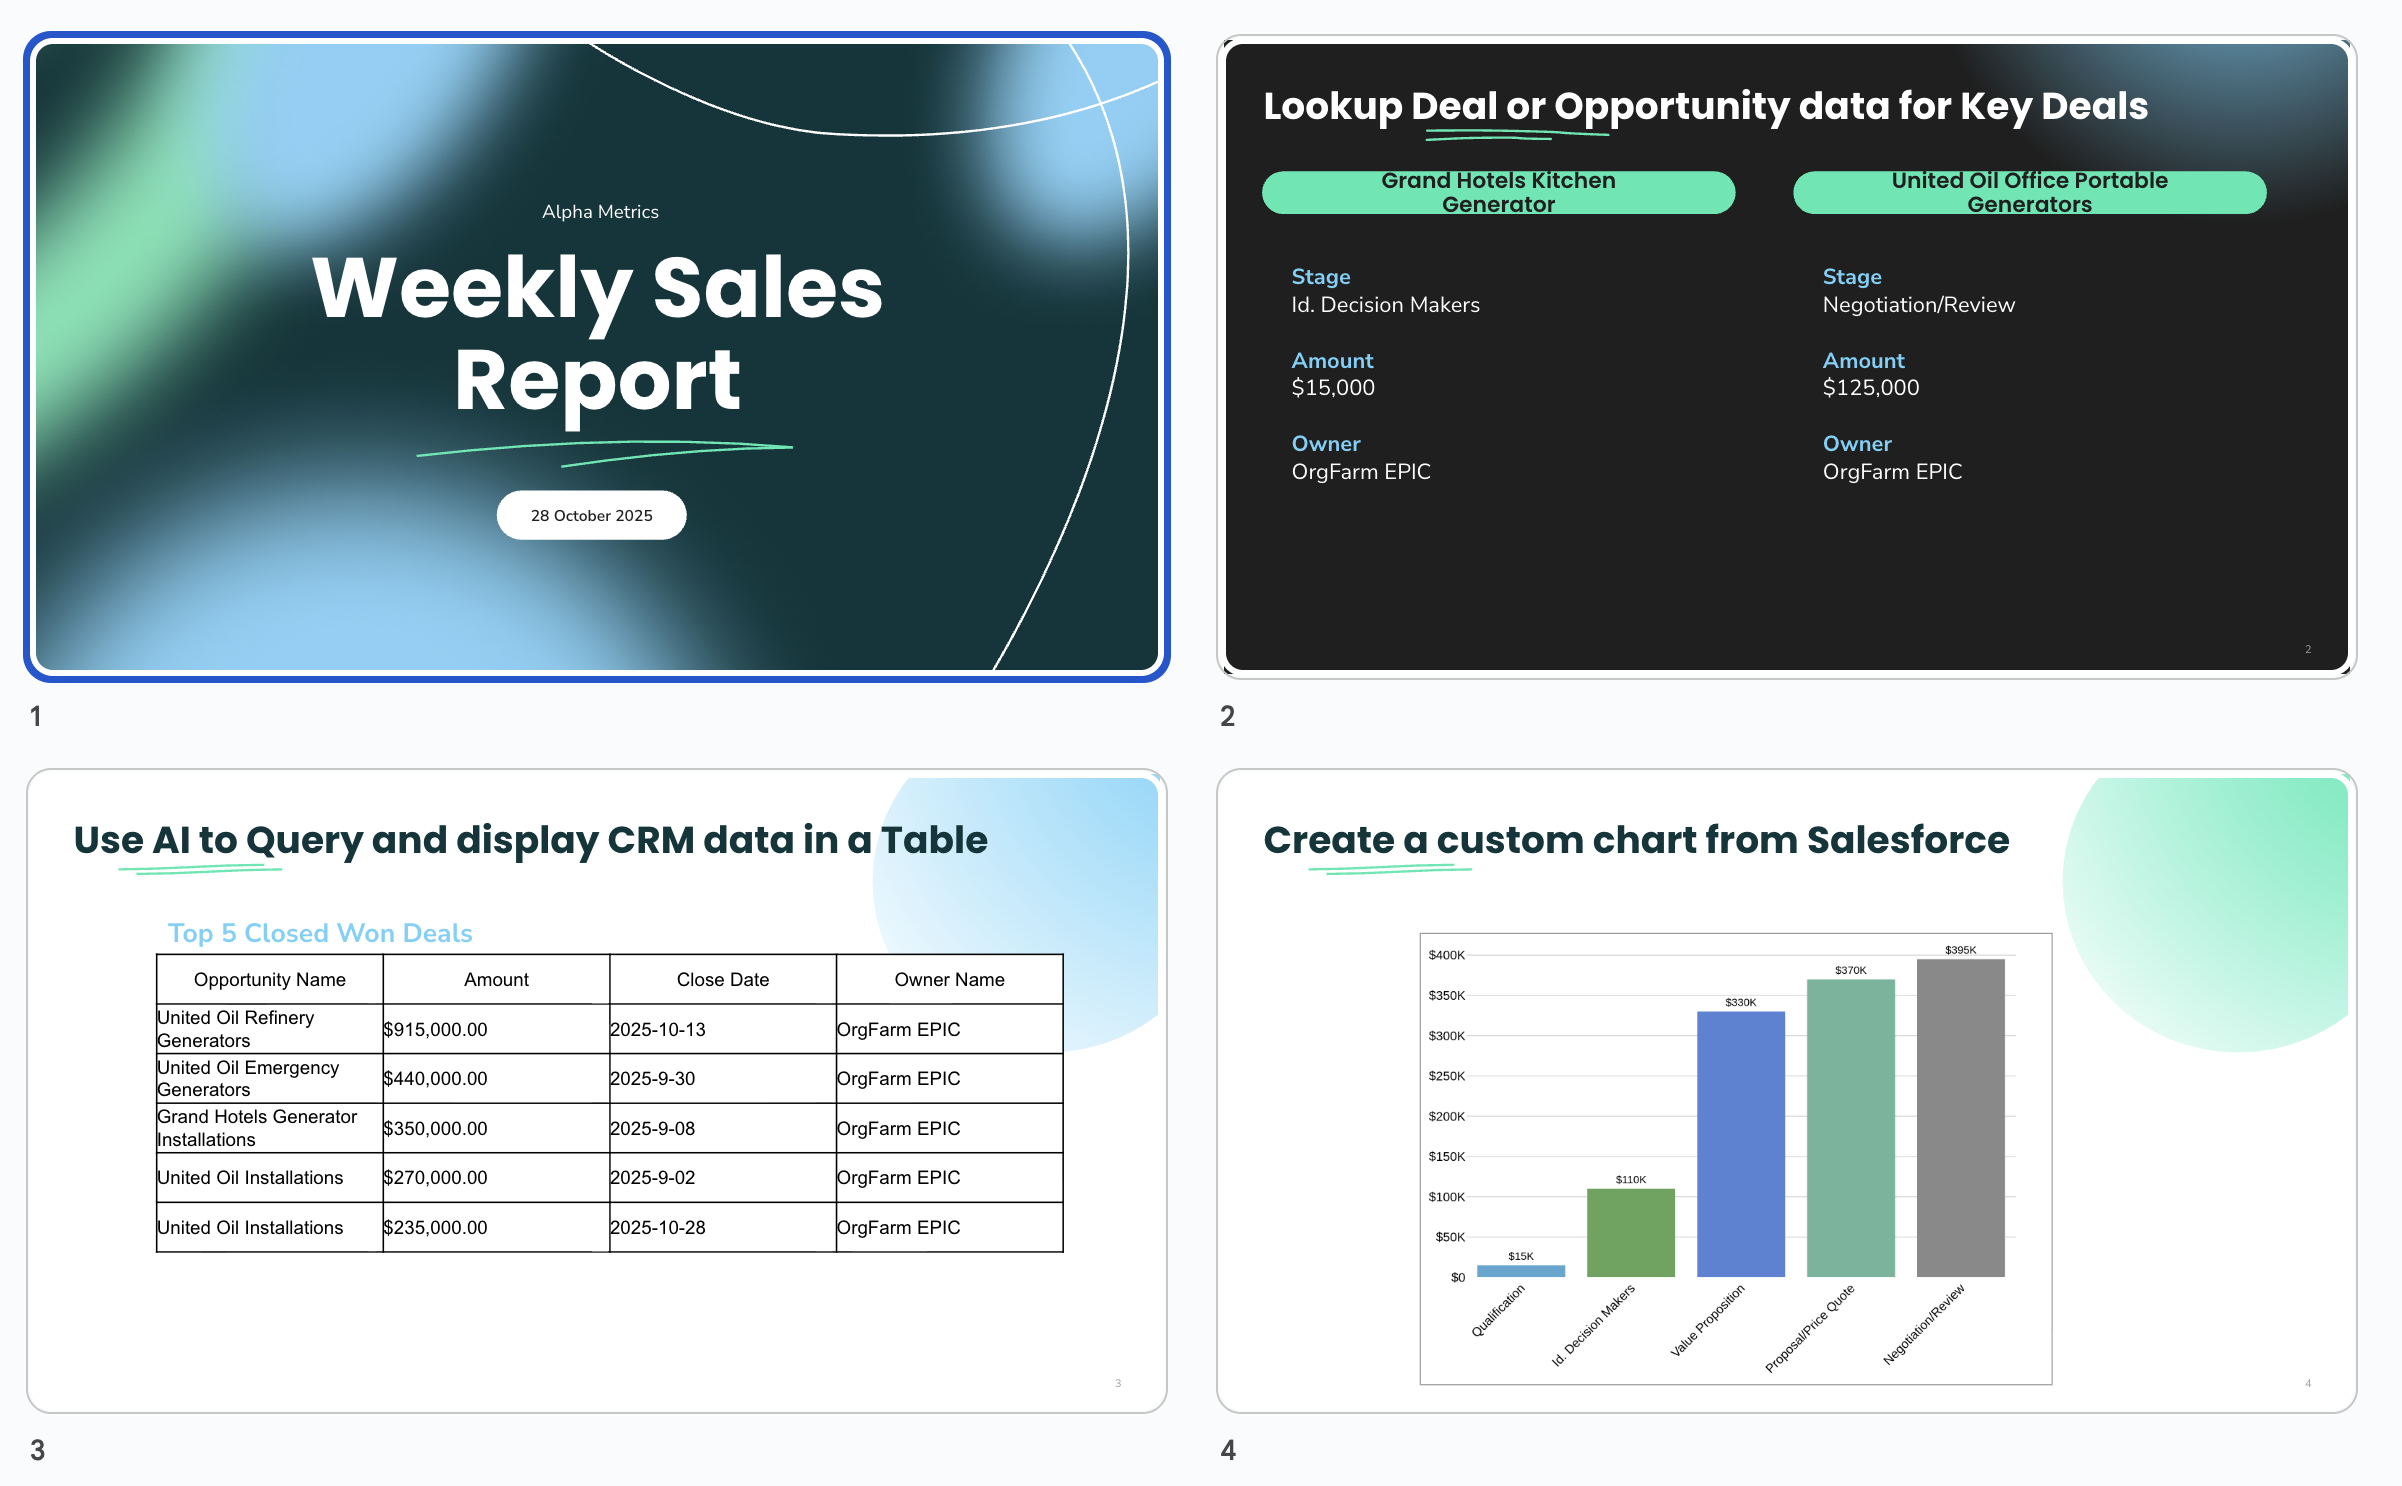
Because the agent works from your template, the final report or presentation is always on-brand. Titles, labels, captions, and even commentary can be included alongside the visual, creating polished, client-ready outputs without touching a slide manually.
You can:
-
Generate a single report on demand
-
Schedule weekly or monthly reports with refreshed visuals
-
Bulk-generate reports filtered by region, rep, or client
And because Slideform integrates with both Salesforce and your presentation tools, there’s no exporting or copy-paste step. Data, visuals, and design are fully automated.
Scale Reporting with AI + Salesforce
Whether you're delivering executive dashboards, client QBRs, or sales performance updates, using your personal data analysis assistant to create visuals from Salesforce data can save hours and improve consistency.
Instead of building slides from scratch, let Slideform extract insights and render custom charts from your data—then drop them directly into your branded deck. That’s the power of AI reporting at scale.
Ready to automate your Salesforce reporting? Book a demo to get started.